Top Native Advertisers on Taboola, Outbrain & MGID (Network Share Breakdown)
Most "top advertiser" lists are guesses; this one is rebuilt from 589,000 live native creatives, classified by real advertiser, network and vertical, then ranked by spread and longevity.
"Who are the biggest advertisers on Taboola right now?" is one of the most-searched questions in performance marketing, and almost every published answer is a guess. The lists you find are a vendor's customer logos, a year-old case study, or a scrape of one placement on one site. None of them tell you what is actually live this week, on which network, in which country.
This study takes a different route. Instead of asking a network who its big spenders are, we rebuild the answer from the ads themselves. Every captured native creative gets classified by its real advertiser, the native ad network that served it, and the vertical it belongs to. Rank those by how widely and how long each advertiser runs, and a leaderboard falls out of the data instead of out of a marketing deck.
The numbers below come from the OpenAdLibrary index as of June 2026: 589,036 creatives, 25,933 distinct advertisers, 926,259 landing-page captures, and 5,424,757 individual ad observations across 42 networks. That is the raw material. Here is how you turn it into a ranking that survives scrutiny.
What "top native advertiser" actually means#
A top native advertiser is one whose creatives appear across the most placements, publisher domains and creative variants on a given network over a sustained window. That is a public, delivery-based proxy for spend, because the real spend numbers sit in each network's private billing. Ranking advertisers this way, per network, shows you who is dominating distribution today, not who bought a case study last year.
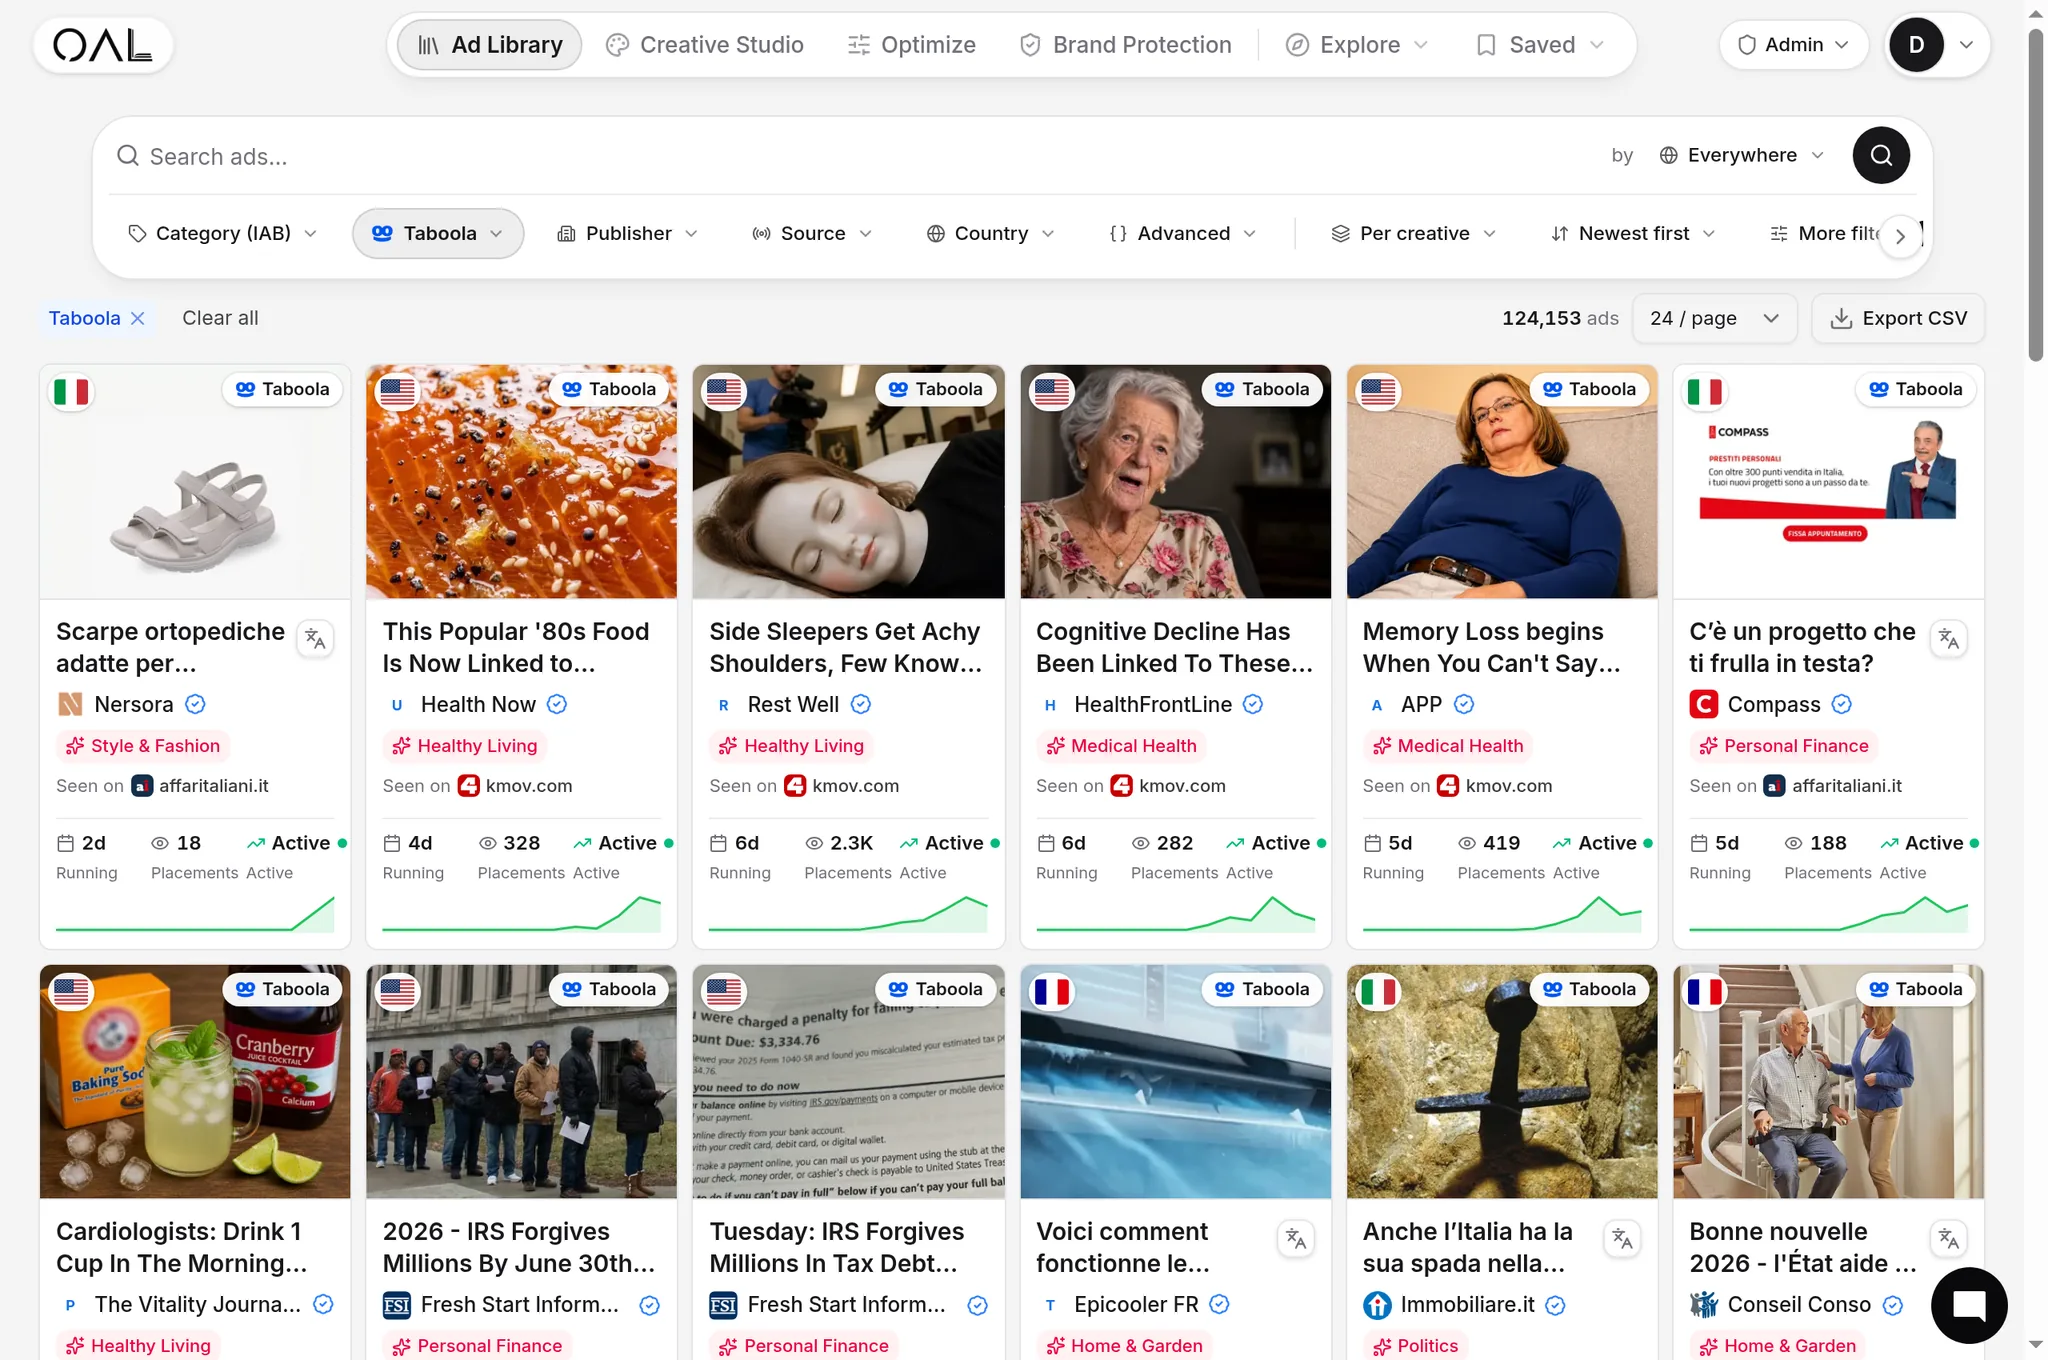
The distinction matters because the three big content-recommendation networks behave like three different economies. You can see it in the raw creative counts we hold for each:
- Taboola is the largest footprint in our index by a wide margin: 157,727 captured creatives. It is also the largest network by publisher payout, expecting to pay over $1.5 billion to publishers and OEMs in 2025 and reaching roughly 600 million daily users across premium sites like NBC News and Yahoo. In 2025 it launched Realize, pushing beyond classic native into broader performance inventory. Its mix skews toward heavyweight direct response plus a growing layer of mainstream brand and e-commerce demand.
- Outbrain sits at 84,252 creatives in our index. It acquired the video and CTV platform Teads from Altice (a deal valued around $1 billion, completed in early 2025), and the combined business now runs publicly under the Teads brand. The merger pulled a heavy video and branding catalogue into what was a performance-native engine, so the advertiser profile is broadening from pure DR toward video-led brand demand.
- MGID holds 49,689 creatives in our index and has been a native network since 2008, spanning roughly 25,000 to 32,000 publishers. It indexes hardest toward aggressive direct response and affiliate demand.
The vertical split inside each network tells the same story from a different angle. On Taboola, our top vertical by creative count is Health (6,048), then Finance (5,558) and Insurance (4,303). Outbrain leads with Finance (2,640) and Insurance (2,615) almost neck and neck, then Health (2,016). MGID is the outlier: Entertainment dominates with 8,904 creatives, more than ten times its next vertical. That single number is the clearest fingerprint of the three. Taboola and Outbrain run on finance and health lead-gen money. MGID runs on entertainment-styled clickbait, the IQ-quiz, "you won't believe," arbitrage end of the market.

That ad above (brand label "Fresh Start Information," 13 days live when we captured it) is exactly the kind of finance lead-gen creative that makes Finance the single biggest vertical across our whole index: 17,232 creatives, ahead of Insurance (15,629) and Health (14,895). If you want the wider context for why native spend keeps concentrating into these channels, that is covered in The State of Native Advertising 2026 (Data From Live Ad Capture), the pillar this study sits under.
The single biggest mistake in advertiser research is treating these three networks as one market. An advertiser ranked first on MGID in a tier-2 geo can be invisible on Taboola's US premium inventory. Share is always per-network, per-geo, never global.
The methodology: from a served ad to a ranked advertiser#
The whole study rests on one capability: turning an anonymous-looking ad unit into an attributed advertiser. Here is the pipeline.
- Capture the live ad. Public native advertising units get captured as they are served: the real creative image at full quality, the headline, the placement, the publisher domain, the geo and the timestamp. That is delivery data, not a media kit. We are sitting on 5.4 million such observations.
- Classify the supply chain. A served native ad is rarely a clean "Brand X to Network to Publisher" line. There are demand hops, resellers, tracking redirects and SSP wrappers in between. Each captured ad runs through supply-chain classification that labels the serving network and the demand path, so the same creative is not double-counted across wrappers.
- Resolve the real advertiser. The on-page brand label and the headline frequently are not the advertiser of record. An affiliate, an agency, or a white-label funnel often sits behind a generic-sounding name. We follow the ad's click path to the landing page or pre-lander (without clicking live ads) and use the destination domain plus its tracking stack to attribute the creative to the actual entity running it. That step is why we hold 926,259 landing captures, roughly 1.6 for every creative.
- Aggregate per advertiser, per network. Once every creative is attributed, it rolls up: how many distinct creatives, how many placements, how many publisher domains, across which geos, over what date range.
- Rank by spread and longevity. The leaderboard sorts on distribution breadth and run-length, not on a single impression estimate, because breadth and persistence are the signals that actually survive scrutiny.
Take the headline on this next one. "MDs Identify 10 Medications Now Attached to Memory Problems In Seniors." The brand label reads "Vital Guardian." That tells you almost nothing about who is paying. Step 3 is the part that does.

The reason step 3 is the hard part, and the reason most "top advertiser" lists are wrong, is explored in depth in Who Advertises on Taboola? Top Native Advertisers by Vertical.
Why spread and longevity beat a spend estimate#
It is tempting to want a dollar figure next to each advertiser. Resist it. Any public spend number for native is a model stacked on assumptions about CPC, fill and undisclosed rate cards: confidently precise and quietly fabricated.
Two signals are far more honest because they are directly observable in delivery.
Spread is how many distinct placements, publisher domains and creative variants an advertiser is live across. An advertiser running 4 creatives on 3 sites is testing. One running 200 creatives across 1,500 domains is scaling. Spread is a clean proxy for share of voice within a network.
Longevity is how long a given creative or offer keeps running. In native, most creatives die within days. The ones that survive have almost always cleared a profitability bar, because nobody keeps paying to serve a loser. A quick honesty note on the numbers: the longest continuous run we have observed on a single creative in our index is 28 days. We launched the continuous-capture pipeline relatively recently, so that 28-day ceiling is a property of our observation window, not a claim that native ads die at four weeks. The industry lore about 90-day evergreen winners is real, it just predates the window we can personally vouch for. When we say "long-running," we mean against our own measured clock.
Even within that 28-day window the pattern is loud. The creatives pinned at the top of our longevity ranking are not glossy brand spots. They are SmartAsset's "How Can I Avoid Paying Taxes on IRA Withdrawals?" finance funnel on Outbrain, Hidden Hearing's hearing-aid ads on the Microsoft Audience Network, and a wall of "My IQ" quiz creatives. Boring, direct, and relentlessly profitable. That is what longevity selects for.

Together, spread and longevity separate the three states every advertiser is in: testing (low spread, low longevity), scaling (rising spread, rising longevity), and milking a proven winner (moderate spread, very high longevity). That framing is the backbone of The Longest-Running Native Ads (And What Makes Them Evergreen), and it is why the leaderboard ranks on these signals rather than on a guessed budget.
Reading the network-share breakdown#
When you aggregate attributed advertisers by network and vertical, a consistent structural pattern emerges even though the specific names rotate constantly. The table below describes that structure. The vertical clusters are drawn from our real per-network creative counts; the advertiser-profile and churn columns are our read on the pattern, not measured figures.
| Network | Top verticals (creatives, our index) | Typical advertiser profile | Creative churn |
|---|---|---|---|
| Taboola | Health 6,048, Finance 5,558, Insurance 4,303 | Large DR buyers plus mainstream brands | Moderate. Premium inventory rewards durable creative |
| Outbrain / Teads | Finance 2,640, Insurance 2,615, Health 2,016 | Performance buyers plus growing video and brand demand | Moderate, shifting as video inventory grows |
| MGID | Entertainment 8,904, Health 615, Insurance 378 | Aggressive DR and affiliate networks | High. Fast rotation, many variants |
Read this as where the weight sits, not who specifically. The vertical clustering is stable. The advertiser names within each cluster turn over week to week, which is exactly why a static list goes stale and a live leaderboard does not.
You can watch the rotation happen in real captures. A solar-subsidy lead-gen ad ("Solar home batteries: Electricians agree about 1 thing") ran 27 days on Taboola in our index. A near-identical AC-unit arbitrage creative from "Consumer World" lasted 5. Same network, same playbook, wildly different shelf life. That gap is the signal you are actually mining.

For the vertical side of this picture in depth, how nutra, finance, crypto and sweeps actually split across networks, see Top Native Ad Verticals in 2026: Nutra, Finance, Crypto & Sweeps by the Numbers.
How to run this breakdown yourself#
You do not have to take an aggregate on faith. The same analysis is reproducible in OpenAdLibrary, and running it on your own vertical is far more useful than any general leaderboard. The workflow:
- Filter to a network and geo. Start narrow, for example MGID in your target country, because share only means something inside one network-geo cell.
- Sort the advertiser view by spread. Look at distinct creatives and publisher domains per advertiser. The top of that list is your real competitive set, regardless of who claims to be the leader.
- Sort the same view by longevity. The advertisers that appear in both the high-spread and high-longevity lists are the ones with proven, scaled, profitable offers. Those are the ones worth reverse-engineering.
- Open the advertiser, follow the click. For each top advertiser, inspect the landing pages and pre-landers behind their creatives to confirm the real entity and the offer mechanics, the part the headline hides.
- Track the cell over time. Re-check weekly. A new name climbing the spread ranking in your vertical is the earliest possible signal of a competitor scaling a winner.
This is also the exact method behind measuring dominance properly. Native Ad Share of Voice: Measuring Who Dominates a Vertical walks through turning spread into a defensible SoV metric you can report. And once you have identified the winning creatives, The Most Common Native Ad Angles (Analyzed From Real Creatives) shows how to decompose why they are winning.
Why this is now possible, and auditable#
Two things make a credible, continuously-updating advertiser leaderboard feasible in 2026 where it was not a few years ago.
First, regulatory transparency normalized the idea. The EU's Digital Services Act now requires very large platforms to maintain public ad repositories disclosing advertiser identity, targeting and reach, retained for at least a year. Enforcement has teeth: the European Commission issued its first major non-compliance fine (120 million euro, against X) in December 2025, partly over an inadequate ad repository. Public accountability for who is advertising is no longer a niche idea. It is the baseline expectation.
Second, live capture plus supply-chain classification closes the attribution gap that the networks' own dashboards never will. A network shows you its own inventory. It will not show you a competitor's whole footprint across rivals. Reconstructing it from served ads does, and that is the only way to compare a Taboola buyer against an Outbrain or MGID buyer on the same axis.
The practical payoff is that the leaderboard is auditable. Every ranked advertiser traces back to specific captured creatives, with the network, placement, geo, capture date and landing page attached. If a ranking surprises you, open the underlying ads and check the work. That is the difference between a data study and a press release.
If you want to see the live version for the network you care about, the Taboola ad spy view is the fastest entry point, and you can build the full per-network advertiser breakdown from there.
OpenAdLibrary is the open, low-cost alternative to the $80 to $400 per month spy tools. It captures live native ads across Taboola, Outbrain/Teads, MGID and 39 other networks, resolves the real advertiser behind each one, and rebuilds the leaderboard continuously. Start free and browse 200 ads with no card to run the breakdown on your own vertical.
The bottom line#
There is no permanent top native advertiser list, and anyone selling you one as fixed truth is selling a snapshot of the past. What is durable is the structure. Finance, Insurance and Health dominate spread and longevity across Taboola and Outbrain (17,232, 15,629 and 14,895 creatives respectively in our index). MGID skews hard toward entertainment-styled clickbait and affiliate demand. Taboola carries the most premium-brand weight and the deepest footprint. Outbrain's profile is broadening post-Teads. The names inside each cluster change weekly, so the only useful leaderboard is one rebuilt from live, attributed, auditable ad capture. Build it for your own network-geo cell, rank by spread and longevity, and you will know who is actually winning before they show up in anyone else's report.