Top Native Ad Verticals in 2026: Nutra, Finance, Crypto & Sweeps by the Numbers
Folklore says nutra and crypto own native, but across 589,000+ live-captured creatives finance, insurance and health actually lead; here's the method to measure native ads by vertical and network yourself.

Ask ten media buyers which vertical "owns" native advertising and you'll get ten answers, each shaped by whatever network and country they happen to run. That's the problem with most vertical rankings. They're anecdote dressed up as data, or vendor estimates with no creatives you can actually inspect. This study takes a different route. Instead of handing you one ranking to memorize, it gives you a reproducible way to measure native ads by vertical from live, classified creatives, plus the signals that separate a genuinely dominant category from one that just looks busy.
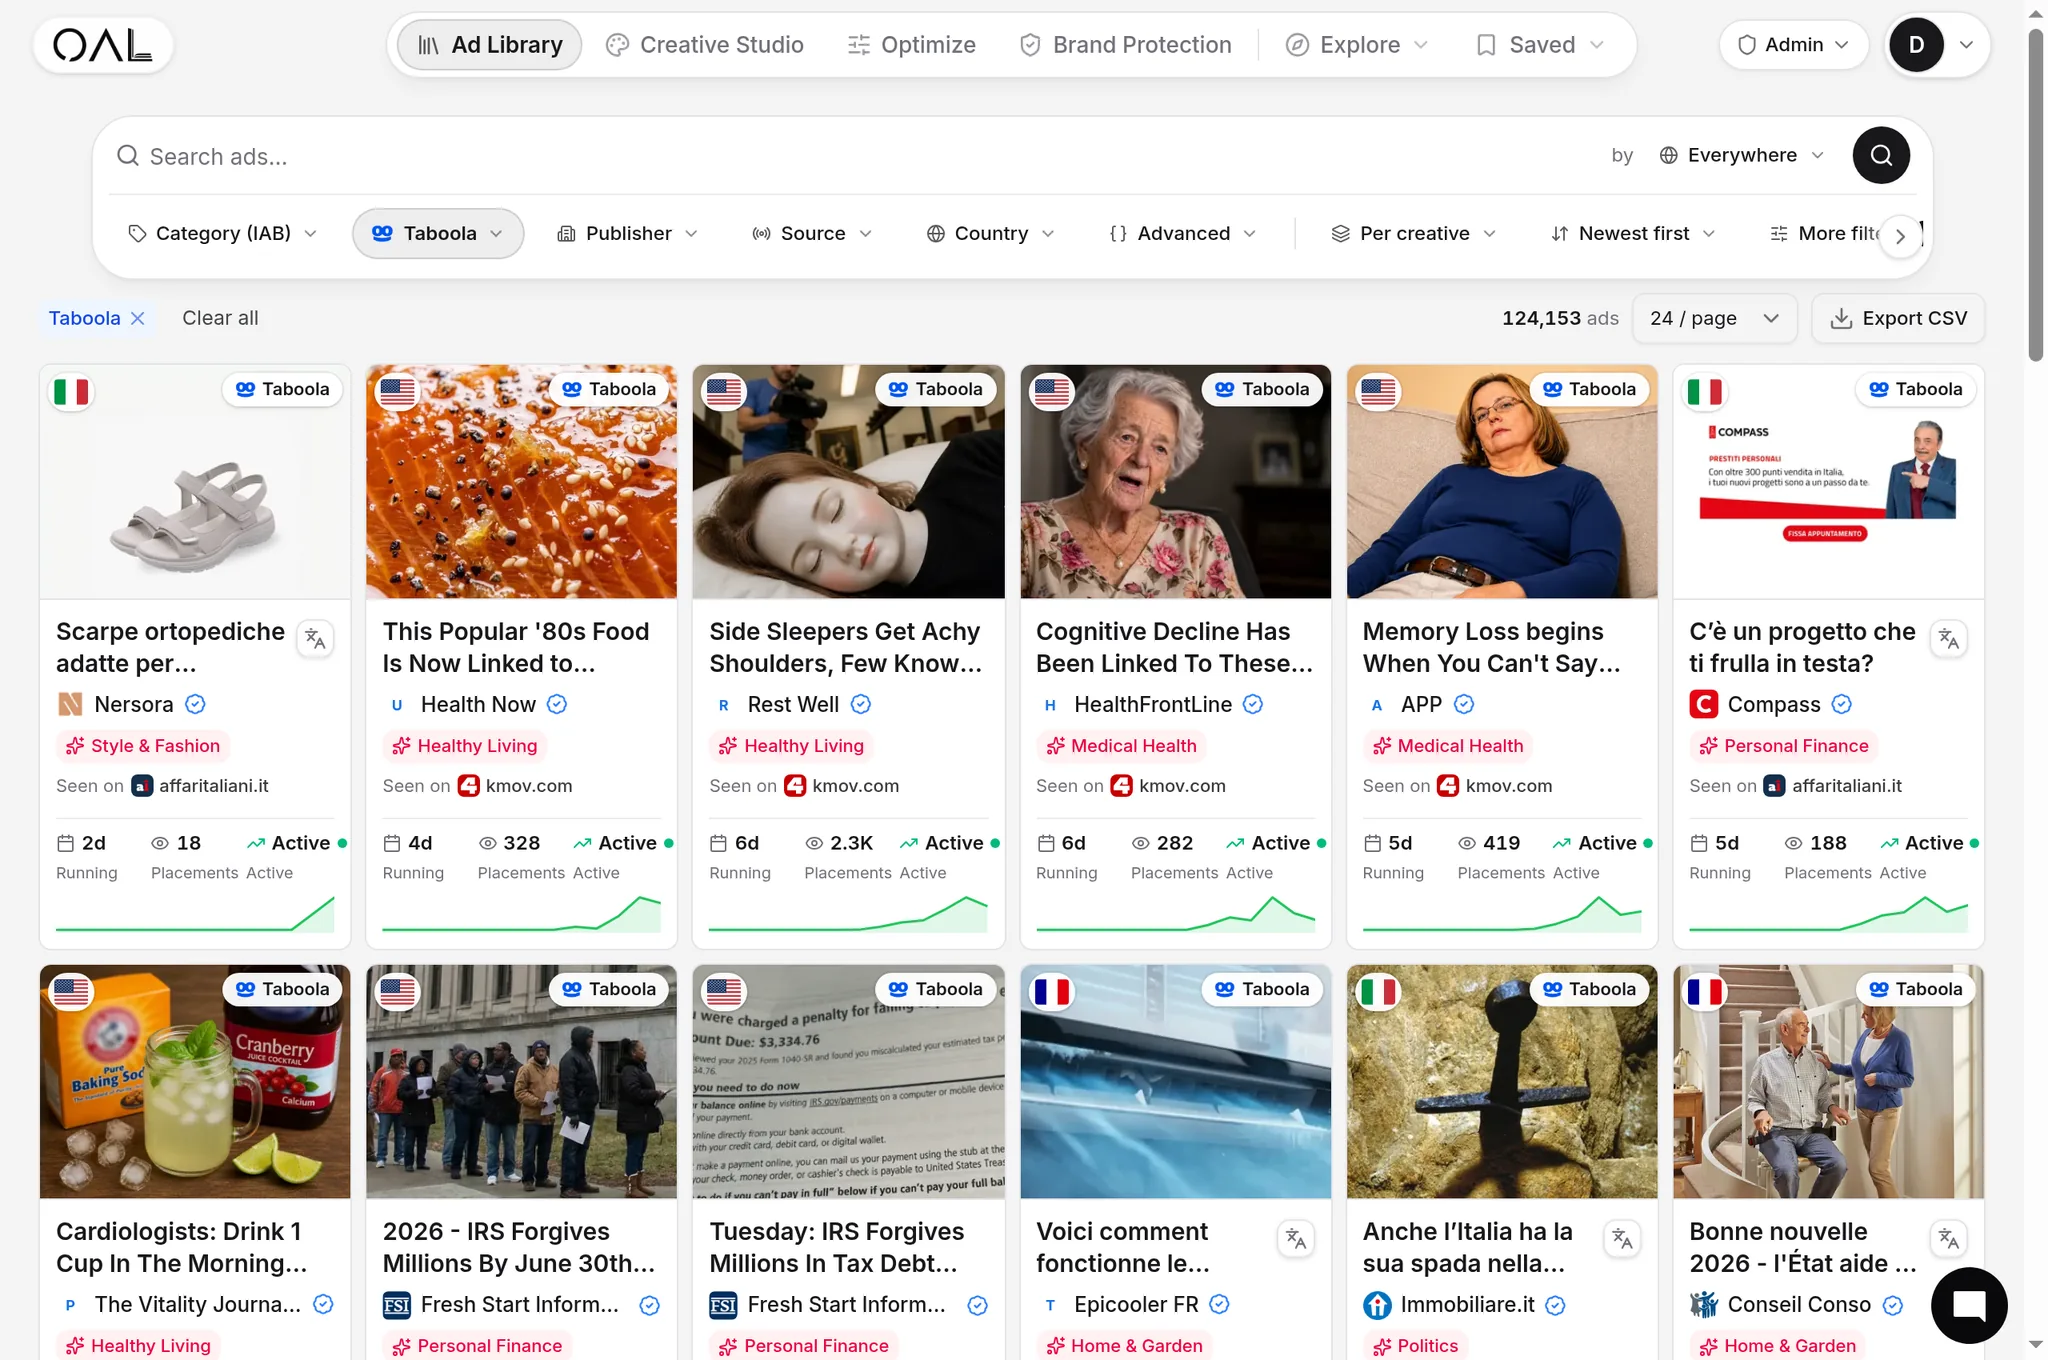
Here is the first surprise, straight from our own index. The four verticals everyone names first are nutra, finance, crypto and sweeps. But across the 589,036 creatives we've captured (OpenAdLibrary index, June 2026), the categories that actually lead by volume are finance (17,232 creatives) and insurance (15,629), with health (14,895) close behind. Crypto and sweeps barely register at the top of the overall count. The folklore and the data disagree, and that gap is exactly why method matters more than any static top-five list.
This is a cluster piece under The State of Native Advertising 2026 (Data From Live Ad Capture). Read that first for the macro picture. This page goes deep on the vertical cut.
What "native ads by vertical" actually measures#
Measuring native ads by vertical means assigning every captured creative to a category, then aggregating those creatives by network, country and time so you can see which verticals concentrate where. The reliable signals are the traced landing page, the real advertiser entity, and the ad's angle and image, in that order. Counts alone mislead. Pairing volume with longevity is what reveals true dominance.
That definition matters because "vertical" is doing two jobs at once. It describes the offer (a keto supplement, a forex broker, a token presale, a prize entry) and it implies a compliance posture (how aggressively a network polices that offer). Both shape where a vertical shows up. If you only ever look at one network, you will badly over- or under-state how big a vertical really is.
, captured by OpenAdLibrary, June 2026.")
The classification method (the part competitors can't fake)#
A vertical figure is only as good as the classification behind it. Here is the order of signals, strongest first, and why each one matters.
- The landing page. This is the single most reliable signal. The same clickbait headline can front a supplement, a loan, or a sweepstakes entry, but the destination rarely lies. Following the click to the advertiser's landing page or pre-lander tells you the real offer. We trace each click to its destination without clicking live ads, so the vertical is read from where the funnel actually goes. That's how we've resolved 926,259 landing captures across the index.
- The advertiser entity. Once you know the real advertiser behind a creative, vertical assignment gets easier and more stable, because most advertisers run within one or two categories. This is also how you move from "lots of finance creatives" to "these 25,933 advertisers are driving the mix, and this handful is driving the finance surge."
- The ad copy and angle. Headlines, body text and the implied promise (curiosity, fear, social proof, a deadline) carry vertical signal even before you load the page. They're noisy on their own but excellent as a tie-breaker.
- The creative image. A blister pack, a stock-chart screenshot, a hearing aid, or a "you've been selected" badge each map to predictable categories. Capturing the real creative at full quality, rather than a thumbnail, is what makes image-based signals usable.
The defensible vertical number is the one you can drill into, creative by creative. If a tool shows you a pie chart but won't show you the ads behind each slice, treat the chart as marketing, not measurement.
This is the line between an auditable study and a guess. A thin competitor can publish "37% nutra" because nothing forces them to show their work. A method built on live capture, real-advertiser resolution and click tracing produces numbers you can verify ad by ad, which is exactly what E-E-A-T and AI-citation engines now reward.
Why the same vertical lands on different networks#
Two forces decide where a vertical concentrates: compliance posture and audience fit. Together they explain almost every surprising vertical split in the data.
Look at how the three biggest networks in our index actually break down. On Taboola (157,727 creatives captured), the top categories are health (6,048), finance (5,558), insurance (4,303) and ecommerce (3,330). On Outbrain, now operating under the Teads brand after the merger closed in early 2025 (84,252 creatives), the leaders flip to finance (2,640) and insurance (2,615) first, then health (2,016). Both are premium-publisher networks placing ads on mainstream news and lifestyle sites, so both skew toward exactly the categories you'd expect from a higher compliance bar.
MGID tells a completely different story. Of its 49,689 captured creatives, entertainment dominates with 8,904, and the rest of its top categories fall off a cliff (health is second at just 615). That's the permissive-network signature: a wide spread of lighter offers, quiz funnels and "you won't believe" content rather than the regulated finance and insurance demand that anchors the premium networks.
, running 26 days at capture, OpenAdLibrary, June 2026.")
Geography overrides everything on top of that. A vertical that dominates one country can be nearly absent in another, driven by local regulation, payment rails and seasonal demand. The Australian life-insurance ad below ("Australians looking for life insurance should read this") is a clean example. It's a category that looks completely different country by country. Any global vertical ranking that ignores country is averaging away the most actionable signal you have.
, captured by OpenAdLibrary, June 2026.")
This is also why a native ad network choice is really a vertical choice in disguise. The mechanics of programmatic native advertising are similar across platforms, but the mix of demand each one attracts is not.
The vertical-by-network grid, from live capture#
Here is how the three networks rank internally, using real creative counts from the June 2026 index. Read the columns, not just the rows.
| Vertical | Taboola | Outbrain / Teads | MGID |
|---|---|---|---|
| Health | 6,048 (#1) | 2,016 (#3) | 615 (#2) |
| Finance | 5,558 (#2) | 2,640 (#1) | not top-6 |
| Insurance | 4,303 (#3) | 2,615 (#2) | 378 (#3) |
| Ecommerce | 3,330 (#4) | 1,479 (#4) | 138 (#5) |
| Entertainment | not top-6 | not top-6 | 8,904 (#1) |
| Software | 2,206 (#6) | 1,197 (#5) | 161 (#4) |
| Total captured | 157,727 | 84,252 | 49,689 |
A vertical's importance is conditional on the network. Finance is #2 on Taboola, #1 on Outbrain, and doesn't crack MGID's top six. Entertainment is invisible on the premium networks and runs away with MGID. That contrast is the whole reason a single global ranking is the wrong tool. For the advertiser-level view of one of these columns, see Who Advertises on Taboola? Top Native Advertisers by Vertical, and for the cross-network share picture, Top Native Advertisers on Taboola, Outbrain & MGID (Network Share Breakdown).
Volume lies; longevity tells the truth#
The biggest trap in vertical analysis is treating creative count as proof of dominance. Sweeps and aggressive nutra generate enormous volume precisely because they churn. Operators spin up dozens of creatives, kill the losers within days, and rotate offers constantly. A raw count rewards that thrash and overstates the vertical's real weight.
The correction is to weight every vertical read with longevity and spread. On longevity: how many days a creative or offer stays live. Our index currently spans up to 28 days of continuous observation per creative, so when we say an ad is a survivor, that's the live ceiling we've watched it hold. Of the longest-running creatives we're tracking at 28 days, the standouts are not nutra at all. They're a SmartAsset finance ad ("Ask a Pro: How Can I Avoid Paying Taxes on IRA Withdrawals?"), a Hidden Hearing health ad, a Combat Siege game, and a cluster of "My IQ" quiz funnels. That is the longevity signal correcting the volume signal in real time. (A note on industry lore: you'll hear about "90-day winners" as a rule of thumb. That's general folklore, not our finding. What we can verify directly is the 28-day window above.) The deeper version of this idea lives in The Longest-Running Native Ads (And What Makes Them Evergreen).
, observed running the full 28-day window, OpenAdLibrary, June 2026.")
On spread: how many distinct publishers, networks and countries a creative reaches. Wide spread plus long life is the signature of a category that's genuinely working, not just spending. And on active-advertiser count: five advertisers running 200 creatives is a different vertical than 200 advertisers running one each. Counting advertisers, not just creatives, is what keeps a few hyperactive accounts from distorting the picture. We've resolved 5,424,757 ad observations to do exactly this kind of survival math.
Put those together and the rankings shift. A vertical that looks #1 by raw volume can fall well behind once you filter for ads that actually survive, and that reshuffle is where the real competitive intelligence lives. To formalize the dominance question across players, see Native Ad Share of Voice: Measuring Who Dominates a Vertical.
The four headline verticals, characterized#
What follows is qualitative pattern set against our real counts, not invented prevalence figures. Use it to calibrate what you'll see when you run the analysis yourself.
Finance and insurance: the premium-network anchor#
This is the real volume story. Finance (17,232 creatives) and insurance (15,629) lead the overall index and both anchor the premium networks: finance is #1 on Outbrain, #2 on Taboola, with insurance right behind it on both. Loans, trading, tax relief, life cover and credit offers fit the higher-compliance environment, tend to run longer than churn verticals, and resolve cleanly at the landing page (rate quotes, account sign-ups, broker funnels). The SmartAsset ad above survived the full 28-day window. That durability is the category's signature.
Health (the nutra-adjacent reality)#
Health is the third-largest vertical overall (14,895) and the #1 category on Taboola. This is where the "nutra dominates" folklore is closest to true, but the live creatives are broader than supplements: hearing devices, memory-and-cognition angles, sleep aids, senior-health "see the list" hooks. Health leans on curiosity headlines and lives or dies on the angle. Because some creatives turn over fast while others run for weeks, this is the vertical where longevity weighting changes your conclusions the most.
, captured by OpenAdLibrary, June 2026.")
Crypto#
Cyclical and sentiment-driven, and notably absent from the top of our June 2026 counts. Crypto concentrates on permissive networks, surges with market cycles, and is heavily geo-gated by regulation. Volume can spike fast, so a single snapshot is especially misleading here. Trend over time matters far more than any one reading, which is the whole reason you should re-run the cut rather than trust a folklore ranking.
Sweepstakes and lead-gen#
The pure-volume folklore vertical, and another one that doesn't lead our overall counts. Short funnels, data-capture forms, "you've been selected" framing, and aggressive rotation. The closest live analog in our index is the quiz-funnel pattern (the "My IQ" cluster) that floods entertainment slots on networks like Microsoft Audience Network. High count, low individual longevity. This is the clearest case where active-advertiser count and survival time tell you far more than the headline creative number.
How to reproduce this analysis in OpenAdLibrary#
You don't have to take any vertical figure on faith, including ours. The method above is exactly what the platform is built to run, and you can do it on the free tier (browse 200 ads, no card required).
- Filter by network and country first. Start narrow: one network, one country, a fixed date window. Global averages hide the signal you're after, the way MGID's entertainment skew gets buried in any cross-network total.
- Read the classified vertical, then verify it. Open the creatives and confirm the category against the traced landing page and the real advertiser, not just the headline.
- Sort by longevity, not count. Surface the creatives that have stayed live longest (we currently observe up to 28 days) to separate proven winners from churn within each vertical.
- Count advertisers, not just ads. Check how many distinct advertisers drive a vertical's volume before you call it dominant.
- Compare across networks. Re-run the same vertical across Taboola, Outbrain/Teads and MGID to see where it actually concentrates. That contrast is the deliverable.
- Watch the creative and the funnel. Use Creative Studio and Copy DNA to break down the winning angles, and follow the click to the landing page to understand the offer behind the share.
Every step rests on data you can inspect: live-captured creatives at full quality, the real advertiser behind each one, and the click traced to its destination across 42 networks. That's the difference between a vertical chart you can defend and one you have to apologize for. For the underlying concepts, the native advertising and native ad network glossary entries give you the precise definitions this method relies on.
If you want to run the vertical-by-network cut on live ads yourself, start free and pull your first 200 creatives without a card. OpenAdLibrary is the open, low-cost alternative to $80 to $400/mo tools, and the prevalence numbers it shows you are auditable, ad by ad, because that's the only kind of vertical data worth trusting.
Sources consulted for platform context: Outbrain completes the acquisition of Teads (Teads); Outbrain completes change of corporate name to Teads (investor relations).