The State of Native Advertising 2026 (Data From Live Ad Capture)
A practitioner's read on native advertising in 2026, built from 589,000+ live-captured creatives: who is advertising, which verticals dominate, and what ad longevity really tells you about the winners.

Native advertising came into 2026 as a consolidated, performance-first channel. Not the brand-awareness experiment it was ten years ago. The two biggest content-recommendation companies restructured around direct response, the EU turned ad transparency into law, and the buyers who win now treat native like a media-buying discipline, not a content play. This page is the hub for our ongoing read on that market, built from the one thing most native commentary lacks: live ad capture.
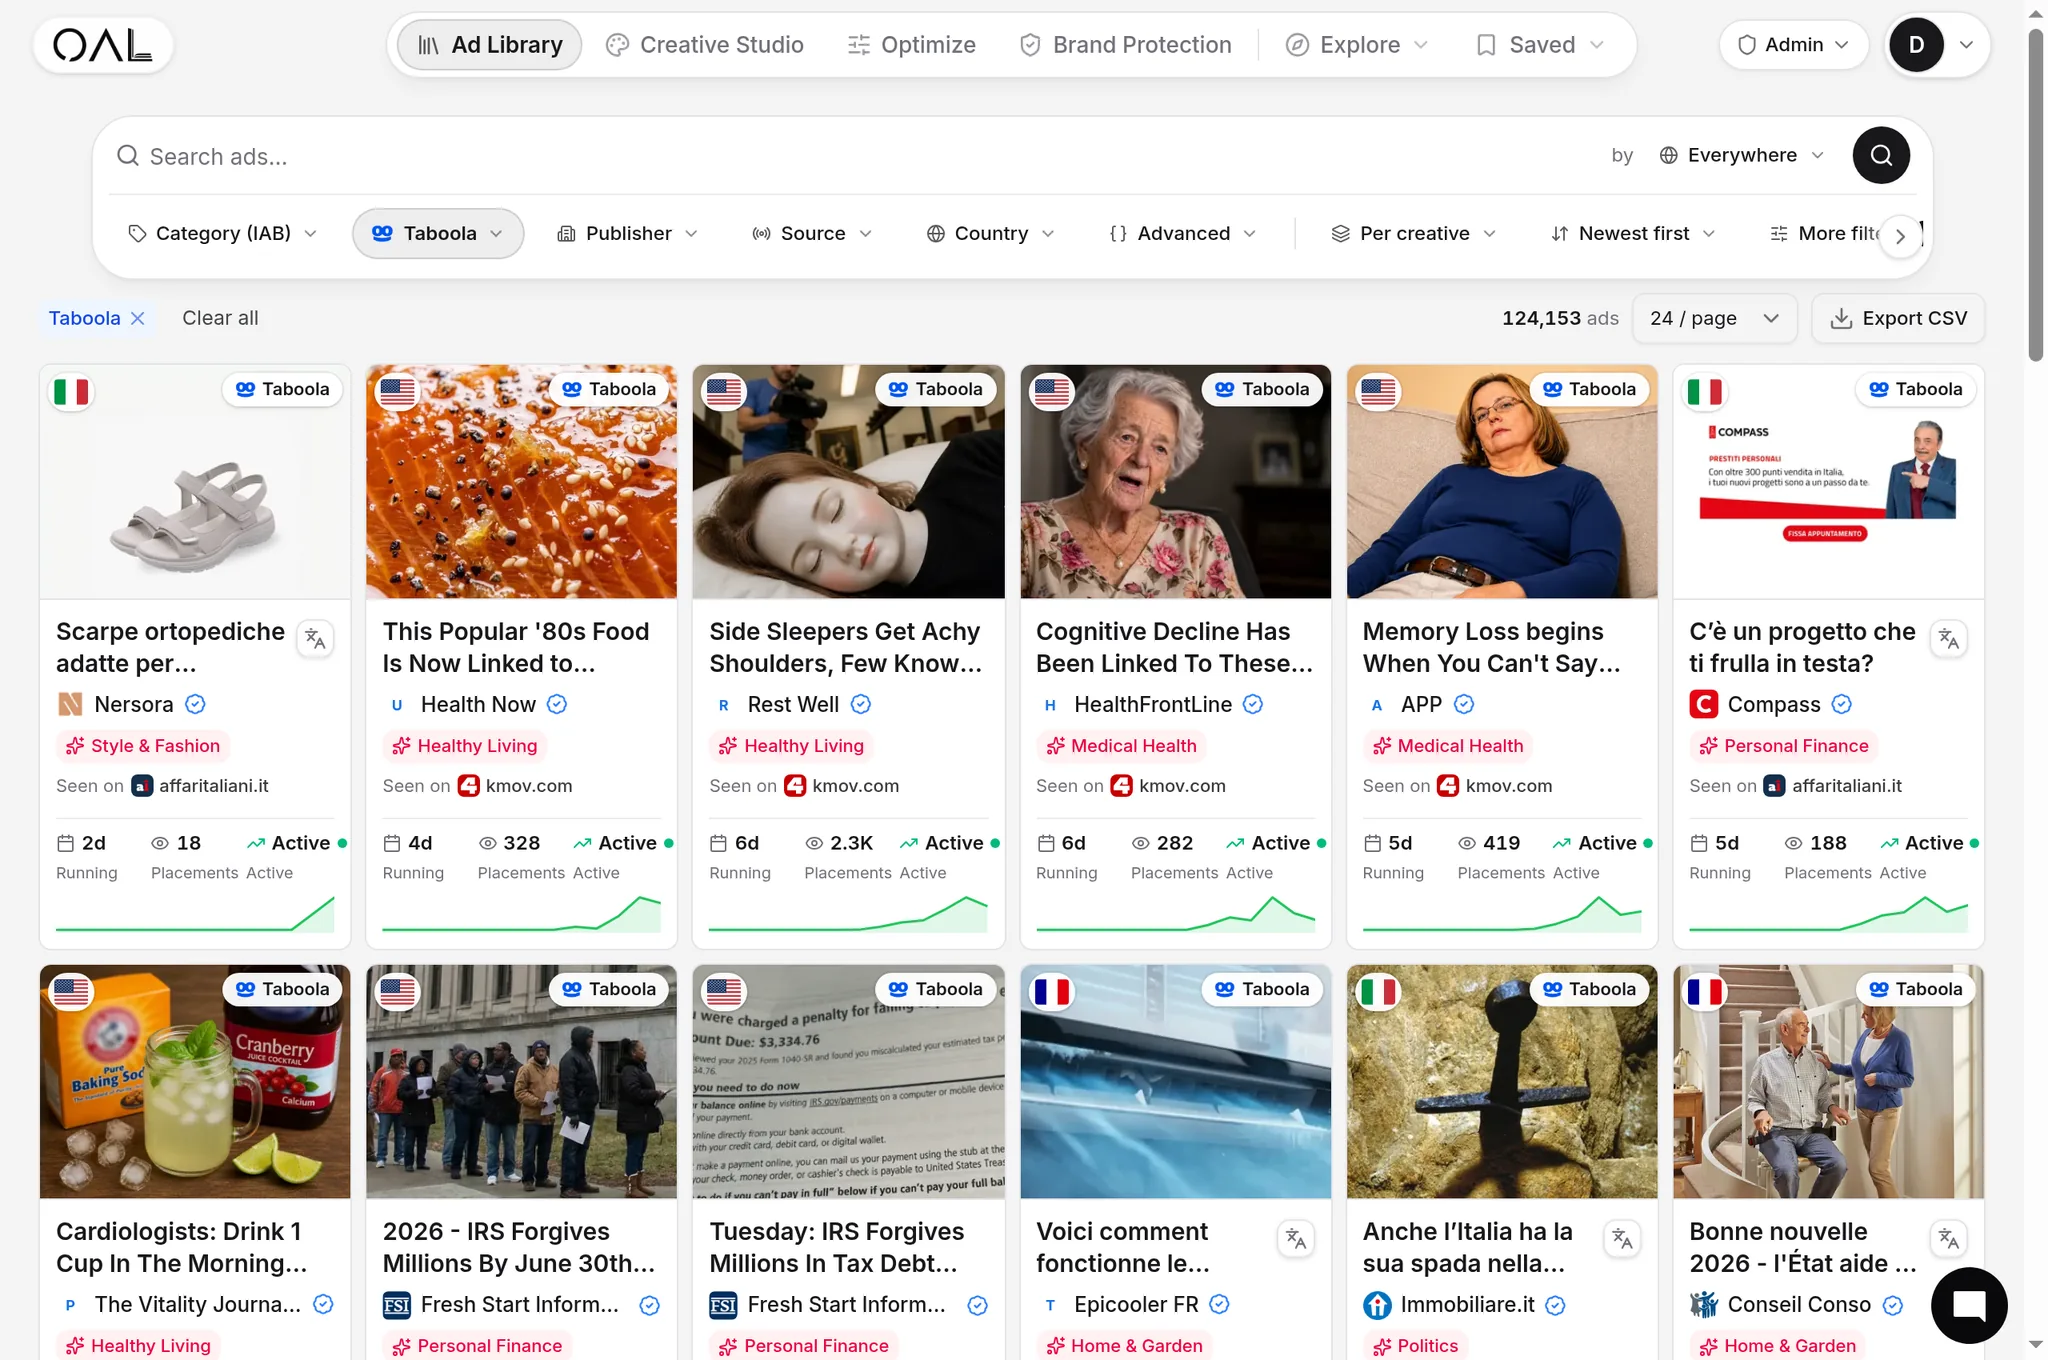
We run continuous capture across the major content-recommendation and open-web networks (Taboola, Outbrain, MGID, Revcontent, Teads, MediaGo, Yahoo, MSN, and others). We record the real creative image, classify the ad-tech supply chain behind each placement, and follow the click to the advertiser's landing page without clicking live ads. As of June 2026 that index holds 589,036 captured creatives, 25,933 advertisers, 42 networks, and 5.4 million individual ad observations (OpenAdLibrary index, June 2026). Everything below is framed by what that primary-source data actually shows, with links out to the deeper studies in this cluster.
What is the state of native advertising in 2026?#
Native advertising in 2026 is a mature, programmatic, performance-driven channel dominated by a handful of consolidated networks. Taboola's Realize platform and Teads (the rebranded, post-acquisition Outbrain) anchor premium open-web supply, while MGID and Revcontent carry the aggressive direct-response demand the majors increasingly screen out. Spend keeps growing double digits, transparency is now regulated in the EU, and the advertisers who win are identifiable by how long their ads run, not by vendor spend estimates.
A quick scale check from our own index: Taboola alone accounts for 157,727 of the creatives we've captured, Outbrain for 84,252, and MGID for 49,689 (OpenAdLibrary index, June 2026). Taboola carries more captured creative than the next two networks combined. That asymmetry matters when you decide where to point your research time.
The five forces reshaping native this year#
If you only track creatives, you miss the structural shifts that decide where your budget should go. Five forces define the 2026 landscape.
1. Consolidation reset the network map#
The most consequential change is corporate, not creative. In February 2025 Outbrain completed its acquisition of Teads and, by mid-2025, rebranded the combined company as Teads, folding the classic content-recommendation business into a full-funnel, video-forward open-web platform. Taboola, meanwhile, repositioned its performance offering under the Realize brand, purpose-built for advertisers optimizing to CPA, ROAS, and conversion volume.
The practical takeaway: the old "Taboola vs Outbrain" framing is outdated. The premium duopoly is now Taboola/Realize and Teads, each pulling toward AI-driven, conversion-optimized buying. The mid-market (MGID, Revcontent, MediaGo) absorbs the demand the majors push away. If you learned native on the old map, re-check which network actually carries your vertical. Our network share breakdown of top advertisers shows how spend distributes across the field today.
2. Spend keeps compounding#
Forecasters disagree on the exact figure. Estimates for the 2026 global native market range widely depending on definition and region. They agree on direction: double-digit annual growth, with US native display spend projected to grow roughly 13% this year. The driver isn't novelty. It's that native reaches an open-web audience in a reading mindset, which suits the long-form pre-landers and advertorials that performance buyers depend on and that walled-garden formats discourage.
You can see the format at work in a single captured ad. This Taboola finance creative ran the classic "IRS forgives" framing on a tax-deadline hook, and we observed it live for 13 days.

3. Transparency became law#
For years, "ad transparency" meant voluntary libraries from the platforms. In 2025 it became a legal obligation in the EU. The Digital Services Act now requires very large online platforms to keep publicly accessible ad repositories, and the EU Regulation on the Transparency and Targeting of Political Advertising (TTPA) entered full application on 10 October 2025, mandating clear labelling, funding disclosure, and targeting transparency for political ads. In April 2026 the Commission adopted the implementing act for a common European political-ad repository with standardized metadata and a shared API.
The regulatory direction is unambiguous: the public has a right to see who is advertising what, where. That is the same principle an open ad-intelligence platform is built on, applied to commercial native, not just political.
For media buyers, the signal is that ad data is becoming a public utility, not a vendor secret. The advantage shifts from access to interpretation.
4. AI moved from buzzword to buying engine#
Both majors now route optimization through machine learning by default. Realize and Teads both lead with AI bidding and creative tooling. On the advertiser side, AI changed creative economics: producing a dozen angle variations is cheap now, so the bottleneck moved from production to knowing which angle to produce. That makes competitive creative intelligence more valuable, not less. The smart move is to study what's already converting rather than guess. (See Creative Studio for how we turn captured winners into editable concepts.)
5. The privacy reset favored contextual native#
As third-party cookies eroded and signal loss reshaped targeting, native's contextual nature (placing relevant content next to relevant editorial) aged well. Buyers leaning on a Data Management Platform (DMP) for audience stitching had to rebuild around context and first-party data, and the native ad auction increasingly rewards creative-and-context fit over behavioral precision.
Who's actually advertising on native in 2026#
Capture data answers the question vendor estimates only approximate: who is in market right now, and how heavily? Across our index, a familiar cast of high-velocity advertisers dominates impression share, but composition differs sharply by network. The table below pairs each network's role with its over-indexed verticals and its real captured-creative count from our index.
| Network (2026 role) | Captured creatives | Over-indexed verticals |
|---|---|---|
| Taboola / Realize | 157,727 | Health, finance, insurance, e-commerce |
| Outbrain / Teads | 84,252 | Finance, insurance, health, e-commerce |
| MGID | 49,689 | Entertainment, health, insurance |
| Revcontent | , | Nutra, "clickbait" health, sweeps |
| MediaGo / Yahoo / MSN | , | Finance, insurance, e-commerce |
The split inside Taboola is telling. Its single biggest captured vertical is health (6,048 creatives), followed by finance (5,558) and insurance (4,303) (OpenAdLibrary index, June 2026). MGID skews completely differently: entertainment alone accounts for 8,904 of its captured creatives, dwarfing every other category on the network. If you assumed all native networks carry the same demand, the data says otherwise.
The names that recur most are rarely the brands you'd guess. They're prolific direct-response operators running dozens of concurrent creatives. We break the rosters down by platform in Who Advertises on Taboola? Top Native Advertisers by Vertical, and compare cross-network presence in the top advertisers by network study. The pattern holds every quarter: a small number of advertisers account for an outsized share of live creatives, and their staying power is the clearest signal of profitability on the open web.
The verticals that own native#
Native's vertical mix is the most stable thing about it, and the most misunderstood. The channel's permissiveness on angles and its reading-mindset audience concentrate certain categories far above their share of the broader ad economy. Here is the top of the table across our whole index (OpenAdLibrary index, June 2026):
- Finance leads with 17,232 captured creatives, leaning on "new rule" and rate-comparison framings.
- Insurance follows at 15,629, often riding the same comparison-and-quote mechanics.
- Health sits at 14,895, the home of before/after and curiosity angles (think hearing aids, memory, sleep).
- E-commerce at 13,872 is the fastest-growing block as the majors court performance retail.
- Entertainment at 11,784 is propped up almost single-handedly by MGID's quiz and game demand.
Software (10,825), travel (10,692), home and garden (7,707), fashion (6,277), and education (6,239) round out the top ten. Health creative is everywhere, and it rarely looks like pharma. This captured Taboola ad is a textbook health-curiosity angle: a "doctors identify medications tied to memory problems" list-bait hook aimed at seniors.

We quantify the full split, including how share has moved year over year, in Top Native Ad Verticals in 2026: Nutra, Finance, Crypto & Sweeps by the Numbers. The reason this matters for your own buying: vertical concentration tells you where the auction is most competitive and most proven. Entering a saturated vertical means competing against advertisers with months of optimization data. Entering a thin one means you're the one paying to learn.
What longevity reveals that spend estimates can't#
Here is the analytical core of how we read native, and why live capture beats modeled spend numbers. You cannot see a competitor's budget or ROAS. But you can see how long their ads run, and across how many publishers. Those two signals, longevity and spread, are the most honest proxies for profitability on the open web, because the economics are brutal: nobody keeps an unprofitable native ad live.
This reframes "winning ad" from a guess into a measurement:
- First-seen date anchors when an angle entered the market.
- Last-seen date confirms it's still running.
- Publisher spread shows scale. A winner runs across many sites, not one.
- Creative iteration reveals optimization. An advertiser tweaking a long-runner is doubling down.
One honest caveat on the numbers. Our continuous-observation window currently spans up to about 28 days per creative, so the durable performers at the very top of our index are the ones we've watched run for the full 28 days without dropping off (OpenAdLibrary index, June 2026). That is our measured finding. The industry lore about "90-day winners" is a separate, broader claim: it is a reasonable rule of thumb across the channel, but it is not something our current capture window proves on its own. Treat the two differently.
What does a 28-day survivor look like? Often something this plain. This Outbrain finance ad from SmartAsset ran the full window we observe, on a quiet "Ask a Pro" advice angle rather than a screaming hook.

The longest-runners skew toward two things. First, evergreen offers that don't depend on a moment: hearing aids, IQ quizzes, tax advice, solar batteries. Second, restrained angles that survive repeated exposure. The IQ-quiz operator "My IQ" shows up again and again at the top of our longevity ranking across multiple creatives, which is exactly the iteration signal you want to read as "this is working, keep going." We catalog these durable performers, and dissect why they last, in The Longest-Running Native Ads (And What Makes Them Evergreen). For media buyers, the longest-runners are a free swipe file of proven structure: the offer fit, the angle, and the pre-lander have all been stress-tested by someone else's budget.
The angles doing the heavy lifting#
Native creative is angle-driven, and the angle space is smaller than it looks. Strip away the surface and most high-performing native ads run a handful of psychological frames: curiosity gaps, "this one trick / new rule," before-and-after transformation, authority and news mimicry, and loss-aversion urgency. The headline-image pairing in the native ad widget is engineered to earn the click. The landing page or pre-lander does the conversion work.
Health and home-improvement angles love the "experts agree about one thing" construction, because it promises a single insight and hides the offer behind a click. This captured Taboola ad runs it on solar batteries, and we observed it for 27 days, near the top of our longevity window.

Reading angles at the portfolio level, not ad by ad, is where the edge is. When one angle dominates the longest-runners in a vertical, that's the proven frame. When a new angle suddenly proliferates across multiple advertisers, that's an emerging trend worth testing before it saturates. Our analysis of the most common native ad angles breaks the taxonomy down from real captured creatives so you can map your own tests against what's already validated.
How to actually spy on native (the primary-source way)#
Most "competitive intelligence" in native is modeled. Vendors estimate spend from panels and extrapolation. That's useful for directional sizing but weak for the decisions buyers actually make: what creative to run, which advertiser to study, where the click really goes. A primary-source approach answers those directly. Here's the workflow we'd recommend, whether you use our platform or another:
- Start from the winners, not the universe. Filter to ads with long run-times in your vertical. Those are the validated structures.
- Trace the click to the destination. The creative is only half the funnel. The pre-lander and landing page carry the conversion. Knowing the real advertiser and destination behind an ad is the difference between admiring a creative and reverse-engineering an offer.
- Measure spread, not just presence. Cross-publisher reach separates a real campaign from a test.
- Watch iteration over time. Creative refreshes on a long-runner tell you where an advertiser is investing.
- Translate, don't copy. Use winners to learn structure and angle, then build your own offer fit.
This is exactly what OpenAdLibrary is built to do. As an open, low-cost native ad spy tool ($29.99/mo, with a free tier to browse 200 ads without a card), it captures live public native ads at full creative quality, classifies the ad-tech supply chain behind each one, follows the click to the real landing page, and surfaces longevity and spread so winners rank themselves. It is the open alternative to the $80 to $400/mo incumbents (Adbeat, AdPlexity, AdSpy, Anstrex), with Creative Studio, Optimize, Copy DNA, and a full API and MCP for programmatic access. Every number on this page comes from that same index of 589,036 creatives, not from a model.
Start free and browse 200 live native ads with no card.
The vocabulary, if you're new to the space#
Native carries a lot of jargon. If any term above was unfamiliar, these glossary entries give precise, practitioner-level definitions:
- Native Advertising covers the foundational definition and formats.
- Programmatic Native Advertising explains how native is bought through automated auctions.
- Programmatic Advertising is the broader auction-based model native sits inside.
- Native Ad Widget is the recommendation unit you see below articles.
- Native Ad Auction is how placements are priced and won in real time.
- Data Management Platform (DMP) is the audience infrastructure reshaped by the privacy reset.
Where this is heading#
The throughline of 2026 is that native's data is catching up to its scale. Consolidation simplified the buying landscape, regulation made ad transparency a public default, and AI made creative cheap, which collectively shifts the advantage to whoever reads the market most clearly. The buyers who win this year aren't the ones with the biggest creative output. They're the ones studying which angles, advertisers, and offers have already been validated by live spend, and acting on it fast.
That's the lens we apply across every study in this cluster. Bookmark this page as the hub, and dig into the network rosters, vertical breakdowns, longevity rankings, and angle taxonomies linked throughout. Each one is built from the same live capture, not estimates.