

Who Advertises on MSN? Advertisers Seen in the Microsoft Feed
Ecommerce, finance and travel dominate MSN's native feed. Here's the advertiser and vertical breakdown from an index of 281,839 live MSN creatives, plus who's actually buying there.


The data desk behind OpenAdLibrary. We turn the platform's corpus of captured native ads, advertisers and landing pages into original studies on what is actually running in the wild, methodology and sample sizes stated on every report.

Ecommerce, finance and travel dominate MSN's native feed. Here's the advertiser and vertical breakdown from an index of 281,839 live MSN creatives, plus who's actually buying there.

Evaluate device-specific creative and funnel behavior, then decide whether separate native campaigns will improve control and measurement.

How to prepare Black Friday native campaigns: the creative patterns that show up in captured ads, offer, tracking and shipping checks, and a September-to-December timeline. Treat seasonal costs and results as hypotheses.

How to compare native campaign costs by country with defined cohorts, local offer economics and clearly labeled planning scenarios. No CPC bands by tier or country are quoted.

Build a native CTR benchmark with defined impressions, clicks, placement context and business outcomes instead of unsourced industry ranges.

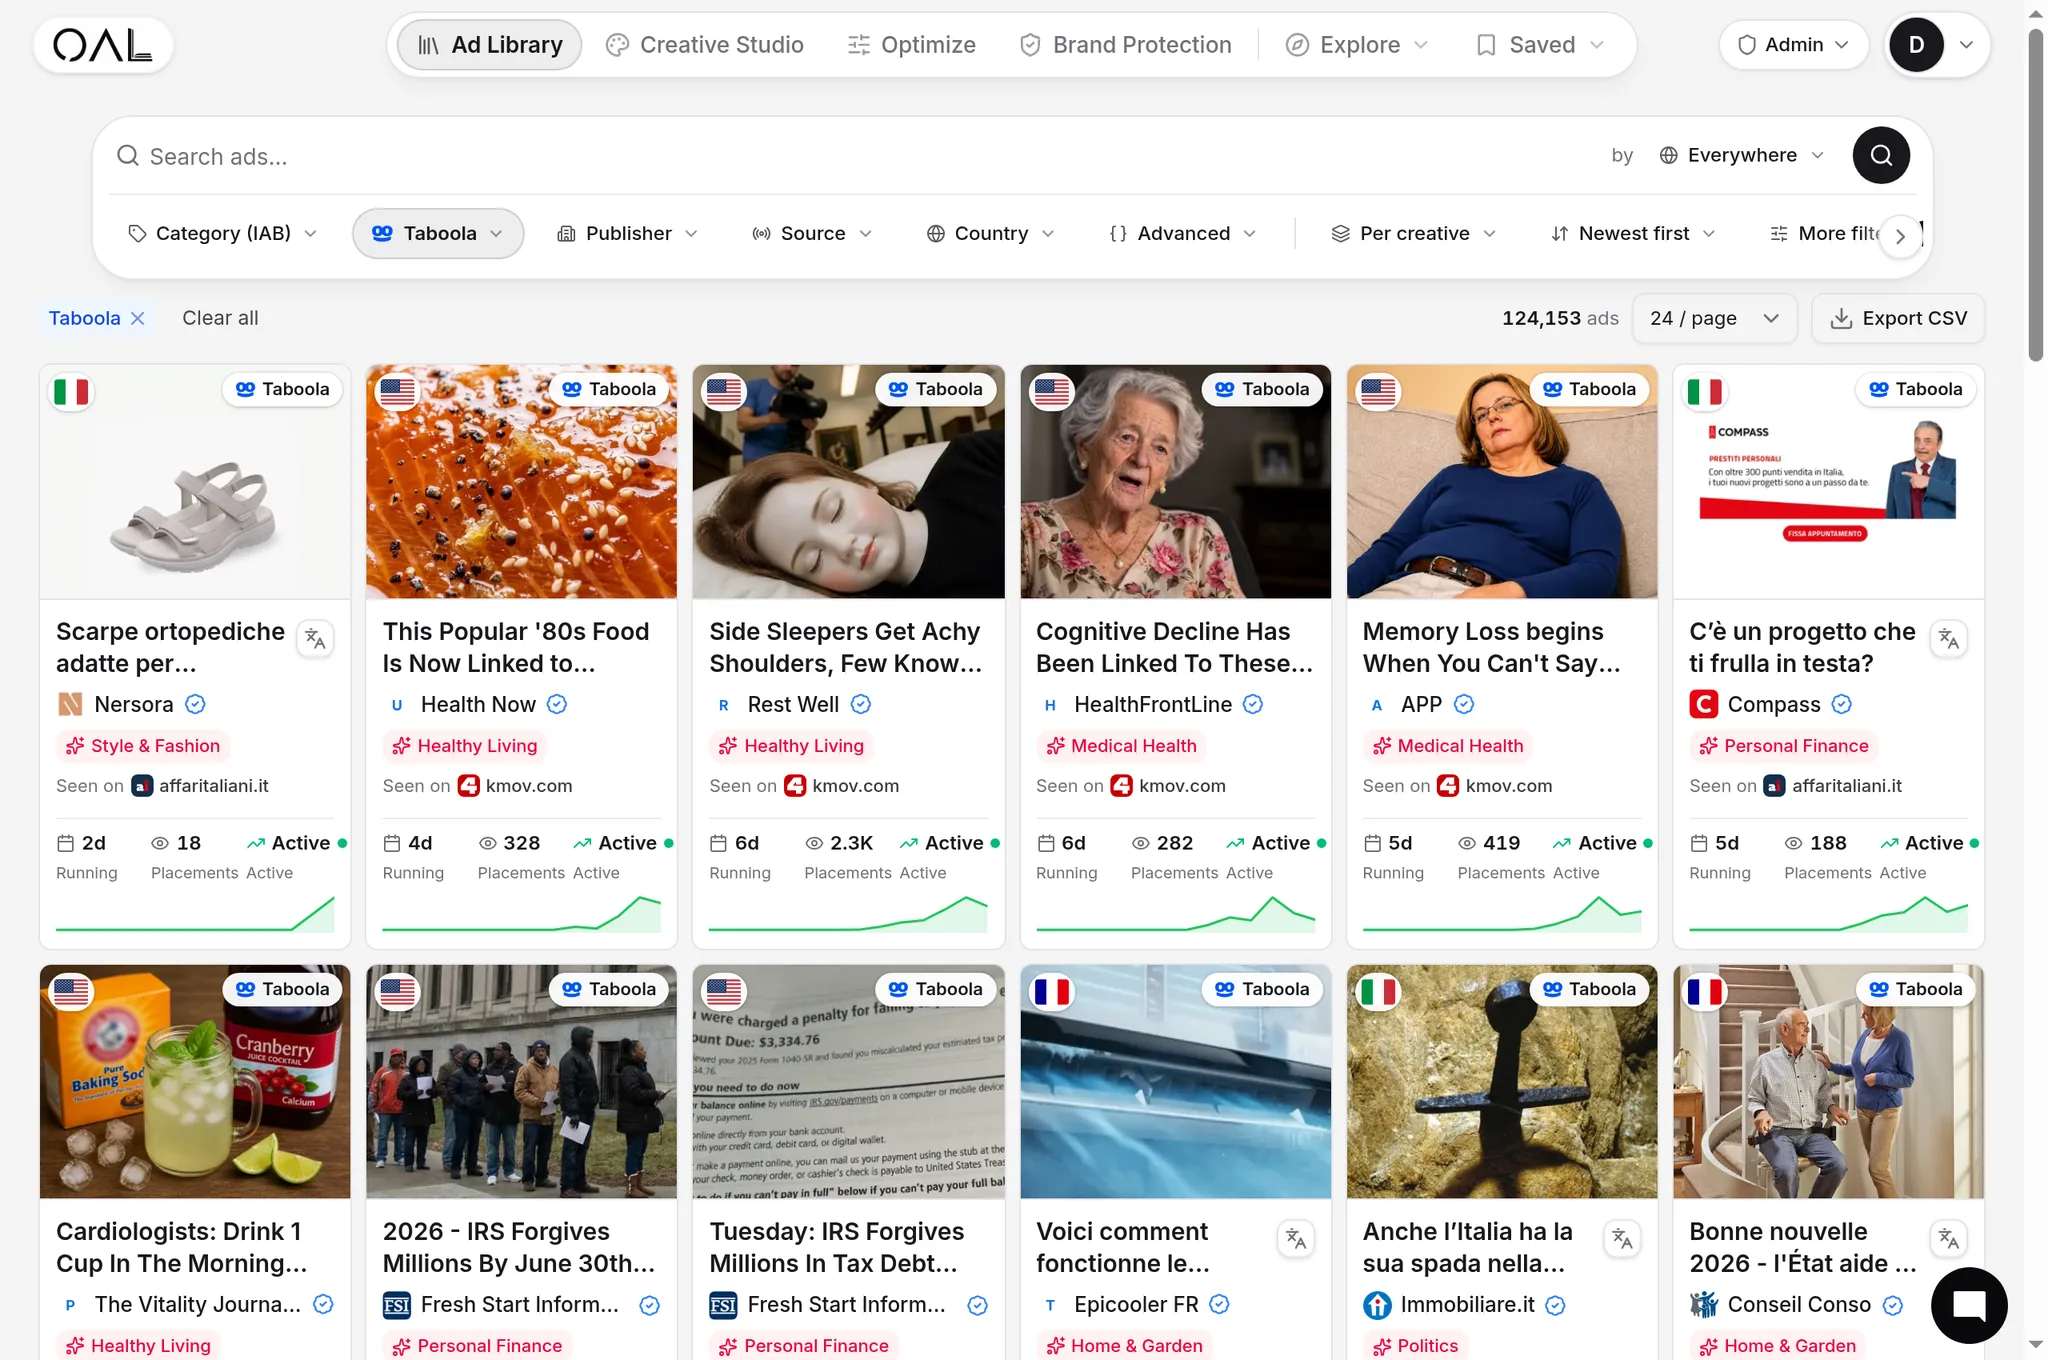
Taboola's reported 2025 company figures, and a dated June 2026 snapshot of 206,145 captured Taboola ads by vertical label, cross-network count and observed runtime, with the limits of each.

Health-ad captures from our native index: which claims and headline formulas recur, how to review the evidence behind them, and why captures cannot show medical accuracy, policy compliance, CPC, CTR or profitability.

What finance-ad captures can show about messages, offers and destinations, and why CPC, conversion and profitability need actual campaign data, not observation counts.

Historical insurance creative counts by network, observed message patterns, and why an ad-capture sample cannot show CPC, spend, demand or what to plan around.

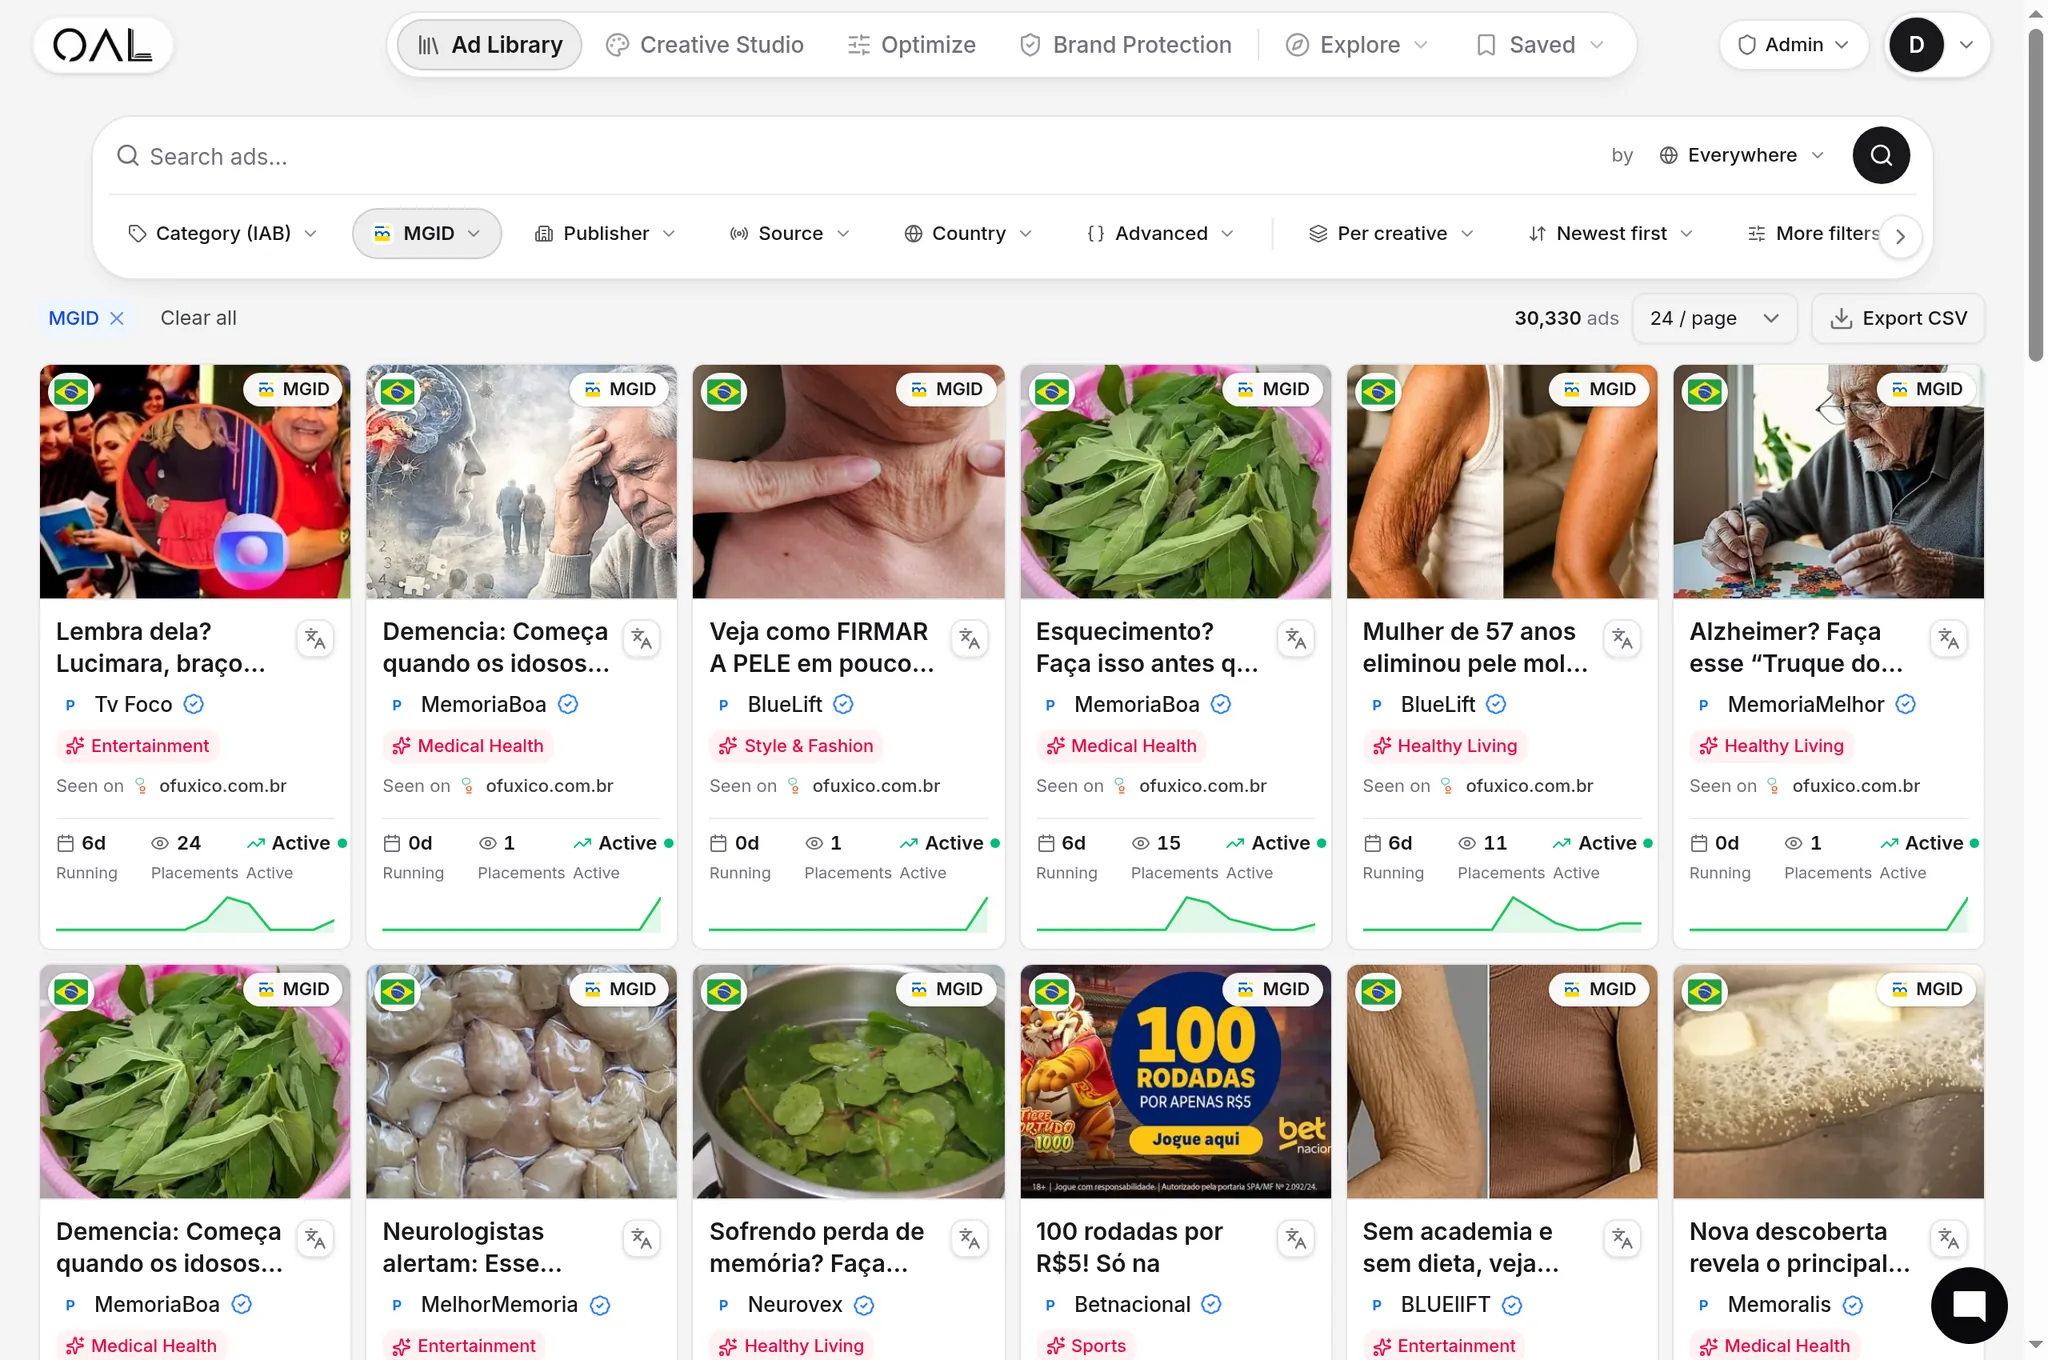
In the captured MGID sample, 13,987 creatives are labeled entertainment, with smaller counts in the other five listed categories. What that partly classified sample shows, and its limits, not a ranking of profitable niches.

Five creative patterns shared by Taboola ads that stayed visible to our capture for three weeks or more in June 2026, from a snapshot of 206,145 captured creatives, and what observed runtime can and cannot tell you.

A look at category examples and messaging in captured Taboola ads. Creative counts do not show which niche is best or where money is made, so a crowded category is worth entering only if you can out-angle it.

50 historical headlines from the earlier OpenAdLibrary collection, grouped into ten writing patterns, with a claim review for each. Examples illustrate patterns, not performance or permission.

We found no first-party RevContent ad library. What a July 2026 snapshot of 14,735 captured RevContent creatives showed by vertical label, the advertorial funnels in the captures, and what the counts cannot show.

Research captured MediaGo creatives, advertiser labels and available destinations from a July 2026 sample, with guidance on reading observation history and coverage limits. It is a sample, not a census.

A July 2026 snapshot of our own collection, not a survey: 1,041,637 creative records, 36,009 resolved advertisers and 10.75M observations across 50 networks, with per-network counts, category mix and observation spans.

Six finance and insurance native ads captured in July 2026 on Taboola, Outbrain and the Microsoft feed: the recurring angles (retirement, IRS/tax, rate shock) and the US disclosure and impersonation rules behind the funnels.

Ten Taboola creatives captured in July 2026, each with its recorded advertiser label, observed span and headline technique: eligibility hooks, casting-call angles, editorial blends, geo-personalization and offer-led cards.

A July 2026 sample recorded 257,553 first-seen MSN creatives in 30 days, a collection statistic, not market share. How the MSN feed works, what msft-ssp and adnxs wrappers show in captured click paths, and how to research it.

Research captured MGID creatives by advertiser and language: 54,585 records as of July, with observation dates, available destinations and the collection and classification limits behind the counts.

We found no public Outbrain ad library. Our independent archive held 92,290 Outbrain (Teads) creative records in an early July snapshot, with advertiser labels, observation dates, traced landing pages and the archive's limits.

Taboola publishes no official ad library. How an independent archive of captured Taboola ads works, what it records (advertisers, observed spans, geo, landing pages), what it can't show, and which features are free.

Spend charts only update after the race is over, so to see what advertisers are scaling right now you read live native ad capture for longevity, spread, and variant signals. Here is the method, with real numbers from 589,000+ captured creatives.

DTC brands quietly buy native ads next to the arbitrage and nutra crowd. Here is a repeatable method for surfacing which ones appear in public captures on Taboola, Outbrain, MGID and Revcontent, by category.

CPC and CTR sit inside ad accounts, so this study measures what is visible from outside: creative volume, observation span and category mix in a June 2026 capture of 589,000+ public native ads, with each measure's limits.

You can't see a competitor's native spend, but you can calculate each advertiser's share of captured creative records in a defined sample, document weighting and coverage, and avoid confusing presence with spend.

Native ads recycle a small set of recurring angles. A working taxonomy of them, plus a repeatable method for measuring how common and how persistent each is in captured creatives, not which ones win.

Learn how to compare first- and last-seen ad observations without mistaking persistence for continuous delivery or profit.

Folklore says nutra and crypto own native, but in a June 2026 snapshot of 589,000+ captured creatives, finance, insurance and health had the most labelled; here's the method, and what counts can't show about market size or profit.

A method for finding the most widely observed advertisers on Taboola, Outbrain and MGID from captured ads: classify by advertiser, network and vertical, rank by spread and observed span, and know what counts and dates can't show.

There's no public list of Taboola advertisers, so here's the exact method we use to reconstruct one from 157,000+ captured Taboola creatives, click-trace landing pages, and supply-chain classification.

Copycat landing pages borrow a trusted brand's identity to mislead visitors through native-ad networks. A method for investigating them: the signals to check, how to record evidence, and why no one signal proves impersonation.

A research framework for comparing native-ad verticals using advertiser counts, creative counts and observation-date spans in captured data. These signals raise research questions; they do not rank profitable verticals.

A descriptive pattern analysis of recurring hooks, image styles and headline structures in captured native ads, and how to run the same analysis yourself. It does not measure conversion or profit.

This guide supplies no network CPC averages. It shows how to judge a reported native CPC benchmark by its source, period and sample, and how to build your own baseline from cost per outcome.

A comparison of MGID and Revcontent for affiliates, built on each network's own published terms and the largest classified categories in our June captures, with steps to check both networks yourself.

Outbrain bought Teads and the parent company now trades as Teads, so here is how to compare the two networks using what each documents plus captured ads, rather than vendor claims alone.