Who Advertises on Taboola? Top Native Advertisers by Vertical
There's no public list of Taboola advertisers, so here's the exact method we use to reconstruct one from 157,000+ captured Taboola creatives, click-trace landing pages, and supply-chain classification.
There is no public directory of Taboola advertisers. Taboola doesn't publish one, and native feeds aren't covered by any regulated public ad library the way Meta and Google paid search are. So the honest answer to "who advertises on Taboola?" is that nobody can hand you a definitive list. You can, however, reconstruct a reliable one from what's already serving in the wild, and refresh it whenever you like.
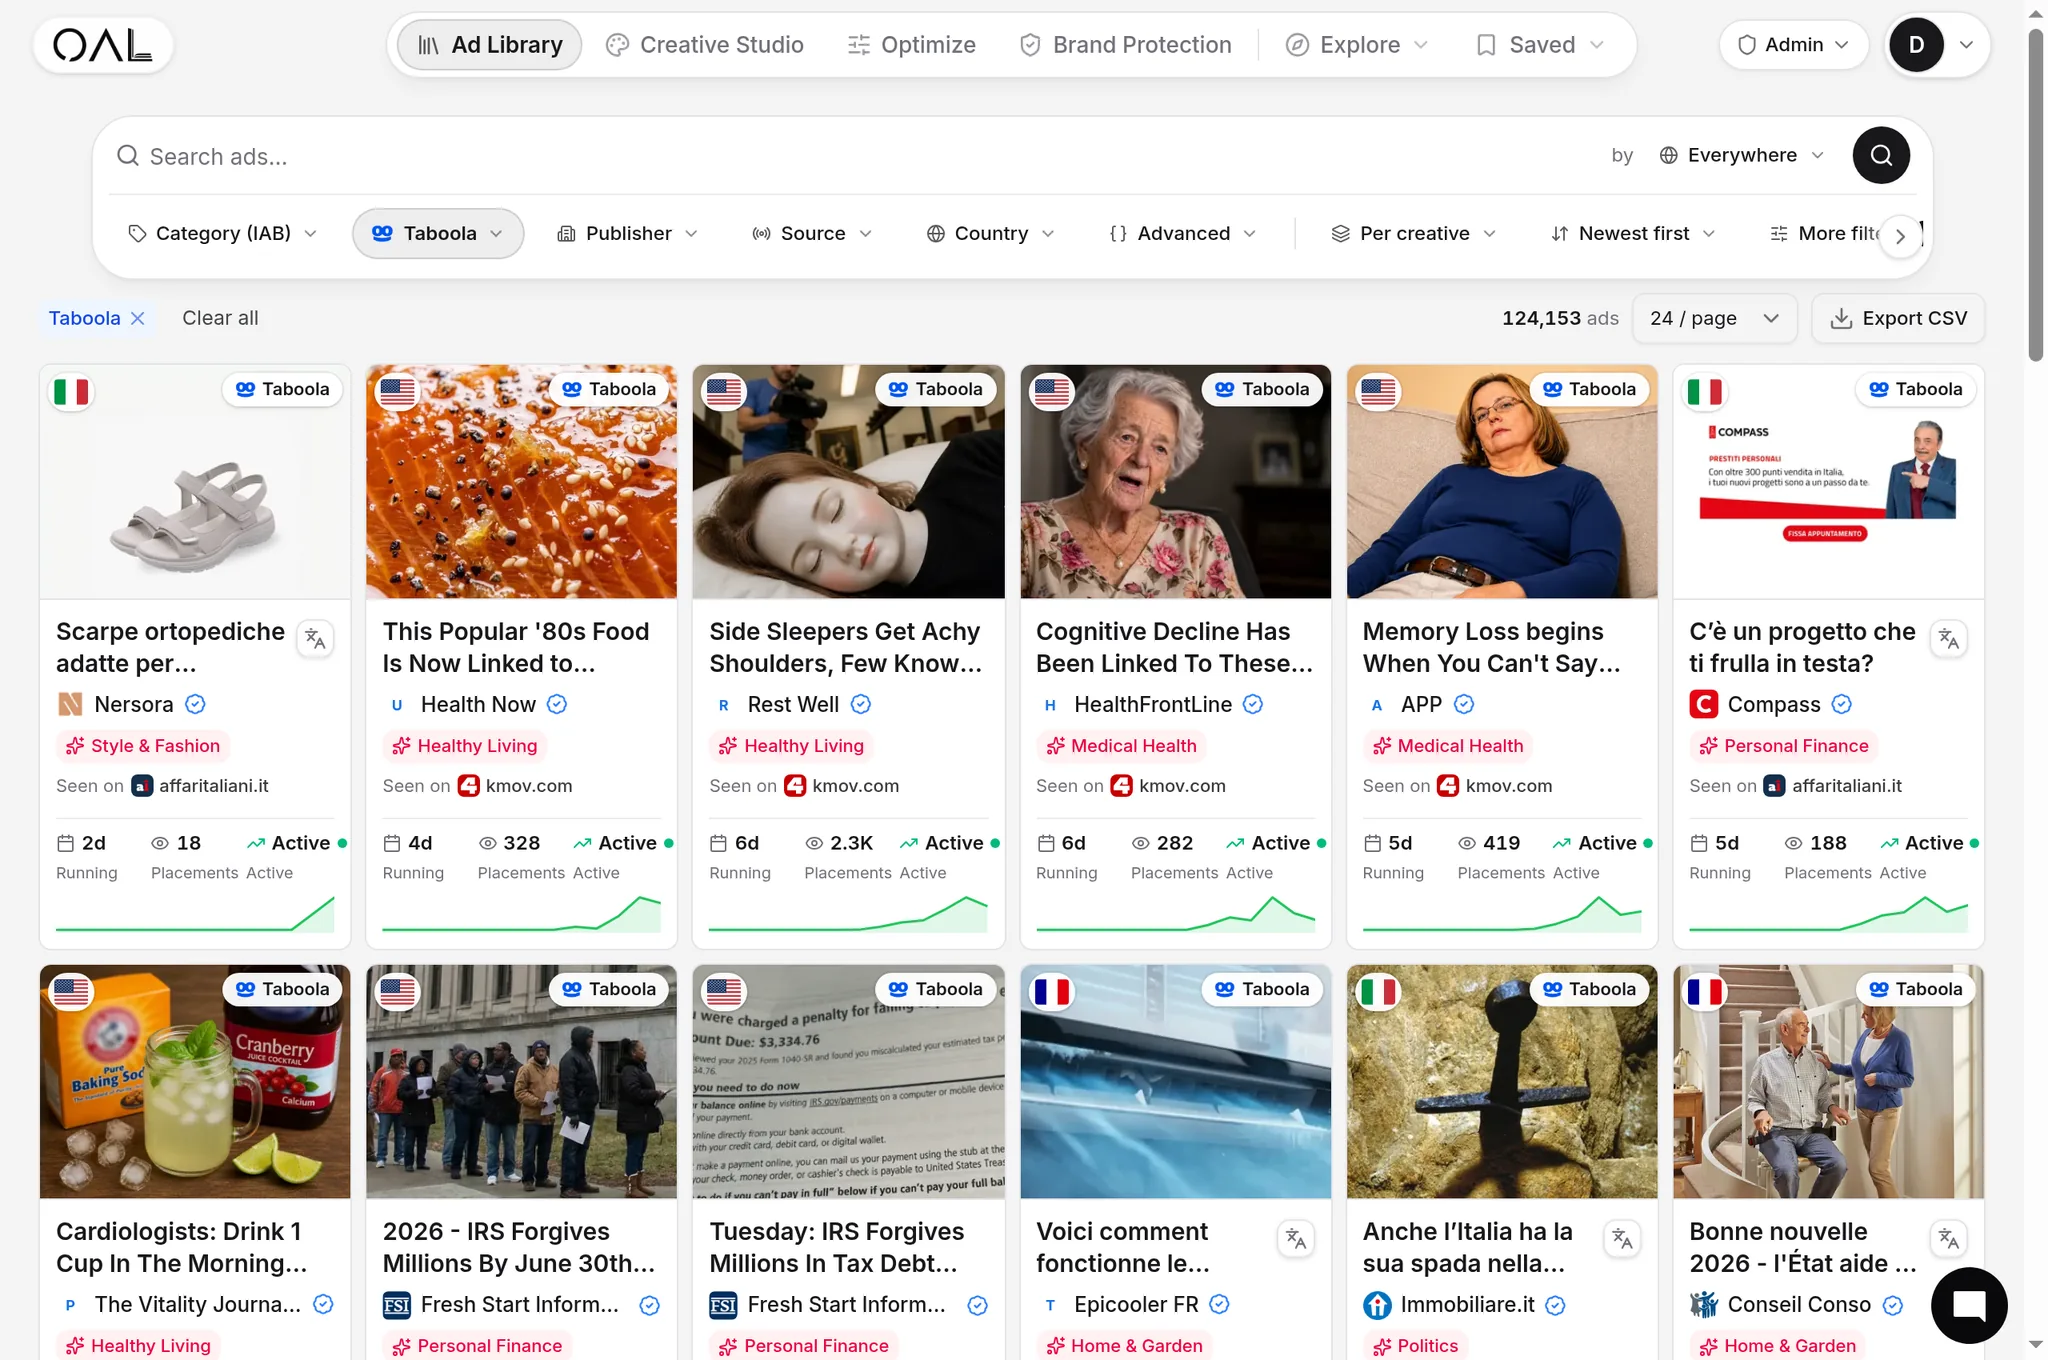
This is a methodology study, not a leaderboard of made-up numbers. Below is exactly how we identify, classify, and rank the advertisers running on Taboola (and on Outbrain, MGID, and Revcontent) by vertical and geo, plus how you can run the same analysis yourself instead of taking anyone's word for it. To ground it: our index currently holds 157,727 Taboola creatives, part of 589,036 creatives and 5,424,757 ad observations across 42 networks and 25,933 advertisers (OpenAdLibrary index, June 2026). For the wider picture this feeds into, see our pillar, The State of Native Advertising 2026.
Who advertises on Taboola, in one paragraph#
Taboola's advertiser base splits into two layers. The big one is direct response: health and supplements, personal finance, insurance, e-commerce, home and garden, software. Most of that is run by affiliates and arbitrage buyers who treat creative like ammunition. The second layer is mainstream brands using native feeds for recirculation and awareness. On our Taboola slice, health leads with 6,048 creatives, then finance at 5,558, insurance at 4,303, e-commerce at 3,330, home and garden at 2,630, and software at 2,206 (OpenAdLibrary index, June 2026). The precise mix moves by country and season, so the right output is a refreshed snapshot, not a fixed list.

That tax ad above is finance in its native habitat: a deadline, a vague authority ("IRS Forgives Millions"), and a brand name you've never heard of doing the buying. Finance is the single largest native vertical in our full index at 17,232 creatives, just ahead of insurance at 15,629 and health at 14,895 (OpenAdLibrary index, June 2026).
Why "who advertises on Taboola" is a hard question#
The difficulty isn't access. Taboola ads are public, served to anyone reading a participating publisher. The difficulty is attribution. Three things make the visible surface misleading.
The label lies, often. The "Sponsored by X" attribution on a native unit frequently names a content brand or an arbitrage media buyer, not the company actually being sold to. A single buyer can run dozens of offers under one shell name.
The buyer isn't the advertiser. Native is full of arbitrage. A buyer purchases cheap clicks, sends them to a content page stuffed with its own ads or affiliate offers, and the "advertiser" you care about is two hops down the chain.
The feed is geo- and session-personalized. What you see in New York at 9am differs from what a reader sees in Sydney or London. Eyeballing one feed tells you almost nothing about who dominates a vertical. Take this Australian insurance ad: you only know it's an Australia-targeted life insurance lead-gen play because the capture recorded the geo, not because the creative announced it.

Add to this that Taboola has pushed well beyond classic native ad widgets into display and broader programmatic native inventory under its Realize performance platform, and the surface an analyst has to watch keeps growing. Any credible answer has to be built from systematic, repeated observation, not a screenshot.
The data-study method#
The approach is the same one any rigorous competitive-intelligence pipeline uses: capture broadly, resolve identity precisely, classify consistently, then rank. Five steps.
1. Capture live placements at scale#
Collect Taboola creatives as they actually serve, across many publishers, devices, and geographies, not a single feed on one machine. Breadth is what separates a real dataset from anecdote. For every observation, store:
- The creative itself (headline, full-quality thumbnail, call to action)
- The publisher and page it appeared on
- The geo and device the impression was served to
- The supply-chain identifiers in the ad markup (the SSP and exchange wrappers, click trackers, pixel domains)
- First-seen and last-seen timestamps
The single most valuable column in a native-ad dataset isn't the headline. It's the destination domain after the click resolves. That's the field that turns "a Sponsored ad" into "a named advertiser."
2. Resolve the real advertiser via the click chain#
This is the step everything else depends on. The reliable identity of an advertiser is the landing page (or the pre-lander before it), not the on-feed label. By following each ad's click chain to its destination, without clicking live ads, by resolving the trace, you recover the actual offer, the brand on the page, and the tracking stack that ties related campaigns together. Two creatives with different headlines and different "Sponsored by" labels that resolve to the same offer domain are the same advertiser running a multivariate test. That's invisible from the feed and obvious from the destination. It's also why our landing-capture count (926,259 resolved landing pages) matters as much as the creative count: the destination is the proof.
3. Classify the supply chain and the vertical#
With the destination and markup in hand, classify two dimensions.
Supply path: which network served it (Taboola versus Outbrain/Teads, MGID, Revcontent), which SSPs and resellers sit in the chain, and which trackers fingerprint the buyer.
Vertical: health, finance, insurance, e-commerce, home and garden, software, content arbitrage, mainstream brand, and so on, derived from the landing-page offer rather than the headline.
This is where headline-only classifiers fall apart. Look at this hearing-device ad. The headline frames it as a consumer-tech scoop ("Americans Are Ditching Hearing Aids for This New Device"), but the destination is a health offer, and that's how it lands in the health bucket.

A destination-based classifier puts that in health every time. A headline classifier might file it under tech or shopping and quietly corrupt your vertical rankings.
4. Roll up by advertiser, vertical, and geo#
Group the classified observations and you can finally rank. The metrics that matter:
| Metric | What it tells you | Why it beats a raw count |
|---|---|---|
| Distinct creatives live | Testing intensity | A buyer running 40 variants is more committed than one running 2 |
| Publisher spread | Reach and budget | Appearing across many publishers implies real spend, not a test |
| Geo spread | Market footprint | Single-geo versus multi-country separates locals from scaled players |
| Longevity (last-seen minus first-seen) | Proven winners | Long-running creatives are usually profitable ones |
| Cross-network presence | Scale and conviction | Same offer on Taboola plus Outbrain plus MGID signals a serious advertiser |
A note on longevity, because it's easy to oversell. Our index currently spans up to about 28 continuous days of observation per creative, so when we say a creative is "long-running" we mean it against that window, not against a calendar year. Plenty of native operators chase the fabled 90-day evergreen winner, and those exist, but that's industry lore, not something we can claim to have measured. What we can show you is the top of our own observed band: this solar-battery ad has been serving on Taboola for 27 of those days, which in arbitrage terms is a small eternity.

Longevity and spread together are the closest public proxy for "who is winning," because no rational buyer keeps a losing creative live across many publishers for weeks. We dig into that signal specifically in The Longest-Running Native Ads (And What Makes Them Evergreen).
5. Refresh on a cadence#
Affiliate and arbitrage advertisers rotate weekly. Mainstream brands persist for months. Any ranking is a snapshot. Re-run weekly for active spy work, monthly for trend reporting. The method stays fixed while the leaderboard moves, which is what makes the analysis durable.
What the rankings tend to show#
Direct response dominates raw volume; brands dominate persistence. You can see both edges in our data. The high-rotation buckets (health, finance, insurance) carry the most creatives because affiliates churn variants constantly. The persistence edge belongs to operators who land one winner and ride it. Here's the kind of profile each vertical produces:
| Vertical | Typical advertiser profile | Dominant signal |
|---|---|---|
| Health / supplements | High-volume affiliates, rapid creative rotation | Creative count, advertorial pre-landers |
| Personal finance / insurance | Mix of lead-gen affiliates and direct brands | Longevity, broad geo spread |
| E-commerce / DTC | Direct brands plus dropship arbitrage | Publisher spread, seasonal spikes |
| Sweeps / lead-gen | Aggressive arbitrage buyers | Short creative lifespans, heavy testing |
| Mainstream / content | Publishers and brands recirculating articles | Persistent placements, low rotation |
The mainstream layer is real, just quieter. Honda runs the New City on Taboola in India with none of the curiosity-gap theatrics the affiliates use, because a known brand is buying recognition, not clicks.

Set Honda's clean brand creative next to the IRS, insurance, hearing, and solar ads above and you've seen the whole spectrum in five images: arbitrage curiosity gaps at one end, a global brand at the other, and a long middle of lead-gen operators. For the vertical-level breakdown with our methodology applied across networks, see Top Native Ad Verticals in 2026: Nutra, Finance, Crypto & Sweeps by the Numbers.
Don't read Taboola in isolation#
Two adjustments separate a useful answer from a misleading one.
Watch across networks. Many of the same advertisers run identical offers on Taboola, Outbrain (now under the Teads brand after Outbrain's 2025 acquisition of Teads), MGID, and Revcontent. SmartAsset is a clean example: its "How Can I Avoid Paying Taxes on IRA Withdrawals?" finance creative is one of the longest-running ads in our index at the full 28-day observation window, and it's running on Outbrain, not Taboola. Looking at Taboola alone undercounts the biggest players, who deliberately diversify supply. The network-share view, who leans Taboola-heavy versus who spreads evenly, is its own analysis, covered in Top Native Advertisers on Taboola, Outbrain & MGID (Network Share Breakdown).
Measure share of voice, not just presence. "Advertiser appears on Taboola" is a yes or no fact. "Advertiser owns 30% of the finance creatives serving in the UK this month" is intelligence. Normalize each advertiser's footprint against the total for a vertical and geo and a list becomes a competitive map. The method is in Native Ad Share of Voice: Measuring Who Dominates a Vertical. Because the same handful of angles recur across the top advertisers, pairing this with The Most Common Native Ad Angles tells you not just who is winning but how.
How to run this analysis yourself in OpenAdLibrary#
You don't need to build the capture pipeline. That's exactly what OpenAdLibrary does. It captures live public native ads across Taboola, Outbrain, MGID, Revcontent and more, stores the real creative image at full quality, classifies the ad-tech supply chain, and follows each ad's click to the advertiser's landing page (without clicking live ads). To reproduce the study above:
- Open the Taboola ad spy view and filter to a vertical and geo.
- Sort by longevity and publisher spread to surface proven winners, not just noise.
- Click into an advertiser to see its full creative set, the resolved landing pages, and the supply-chain classification.
- Use Copy DNA to cluster creatives by the underlying offer so multivariate tests collapse into one advertiser.
- Export, or query the API and MCP, to pull the rankings into your own reporting on a schedule.
It's the open, affordable alternative to $80 to $400 a month legacy spy tools. A free tier lets you browse 200 ads with no card, and full access is $29.99 a month. If you want to stop guessing who advertises on Taboola and start measuring it, start free and run the analysis on a live dataset today.
The one-line takeaway#
There's no canonical list of Taboola advertisers, but there's a repeatable method to build your own: capture live placements broadly, resolve the real advertiser by the landing page rather than the on-feed label, classify supply path and vertical, then rank by longevity and spread. Do that on a cadence and you'll always have a current, defensible answer to who's actually winning on Taboola.