Taboola vs Outbrain in 2026: Data-Backed Comparison (Now Teads)
Outbrain bought Teads and the parent now trades as Teads, so here is how to compare the two networks using live ad data instead of vendor claims.

If you are weighing Taboola against Outbrain in 2026, start with the fact most comparison posts still get wrong: Outbrain bought Teads, and the parent company renamed itself Teads. The corporate entity once called Outbrain Inc. closed its acquisition of the video and CTV firm Teads in February 2025, then renamed itself Teads Holding Co. and started trading on the Nasdaq as TEAD in June 2025. Any "Taboola vs Outbrain" piece that skips this is working from a pre-2025 map.
That does not mean Outbrain vanished. As a network you actually buy native inventory through, the Outbrain recommendation widget still runs. It just sits inside a bigger Teads omnichannel pitch now, packaged with video and connected-TV. So the real 2026 question is not "which of two pure-play native networks wins." It is "how does the surviving Outbrain native product, now Teads-owned, stack up against an independent Taboola that powers Yahoo." That reframing changes which signals matter.
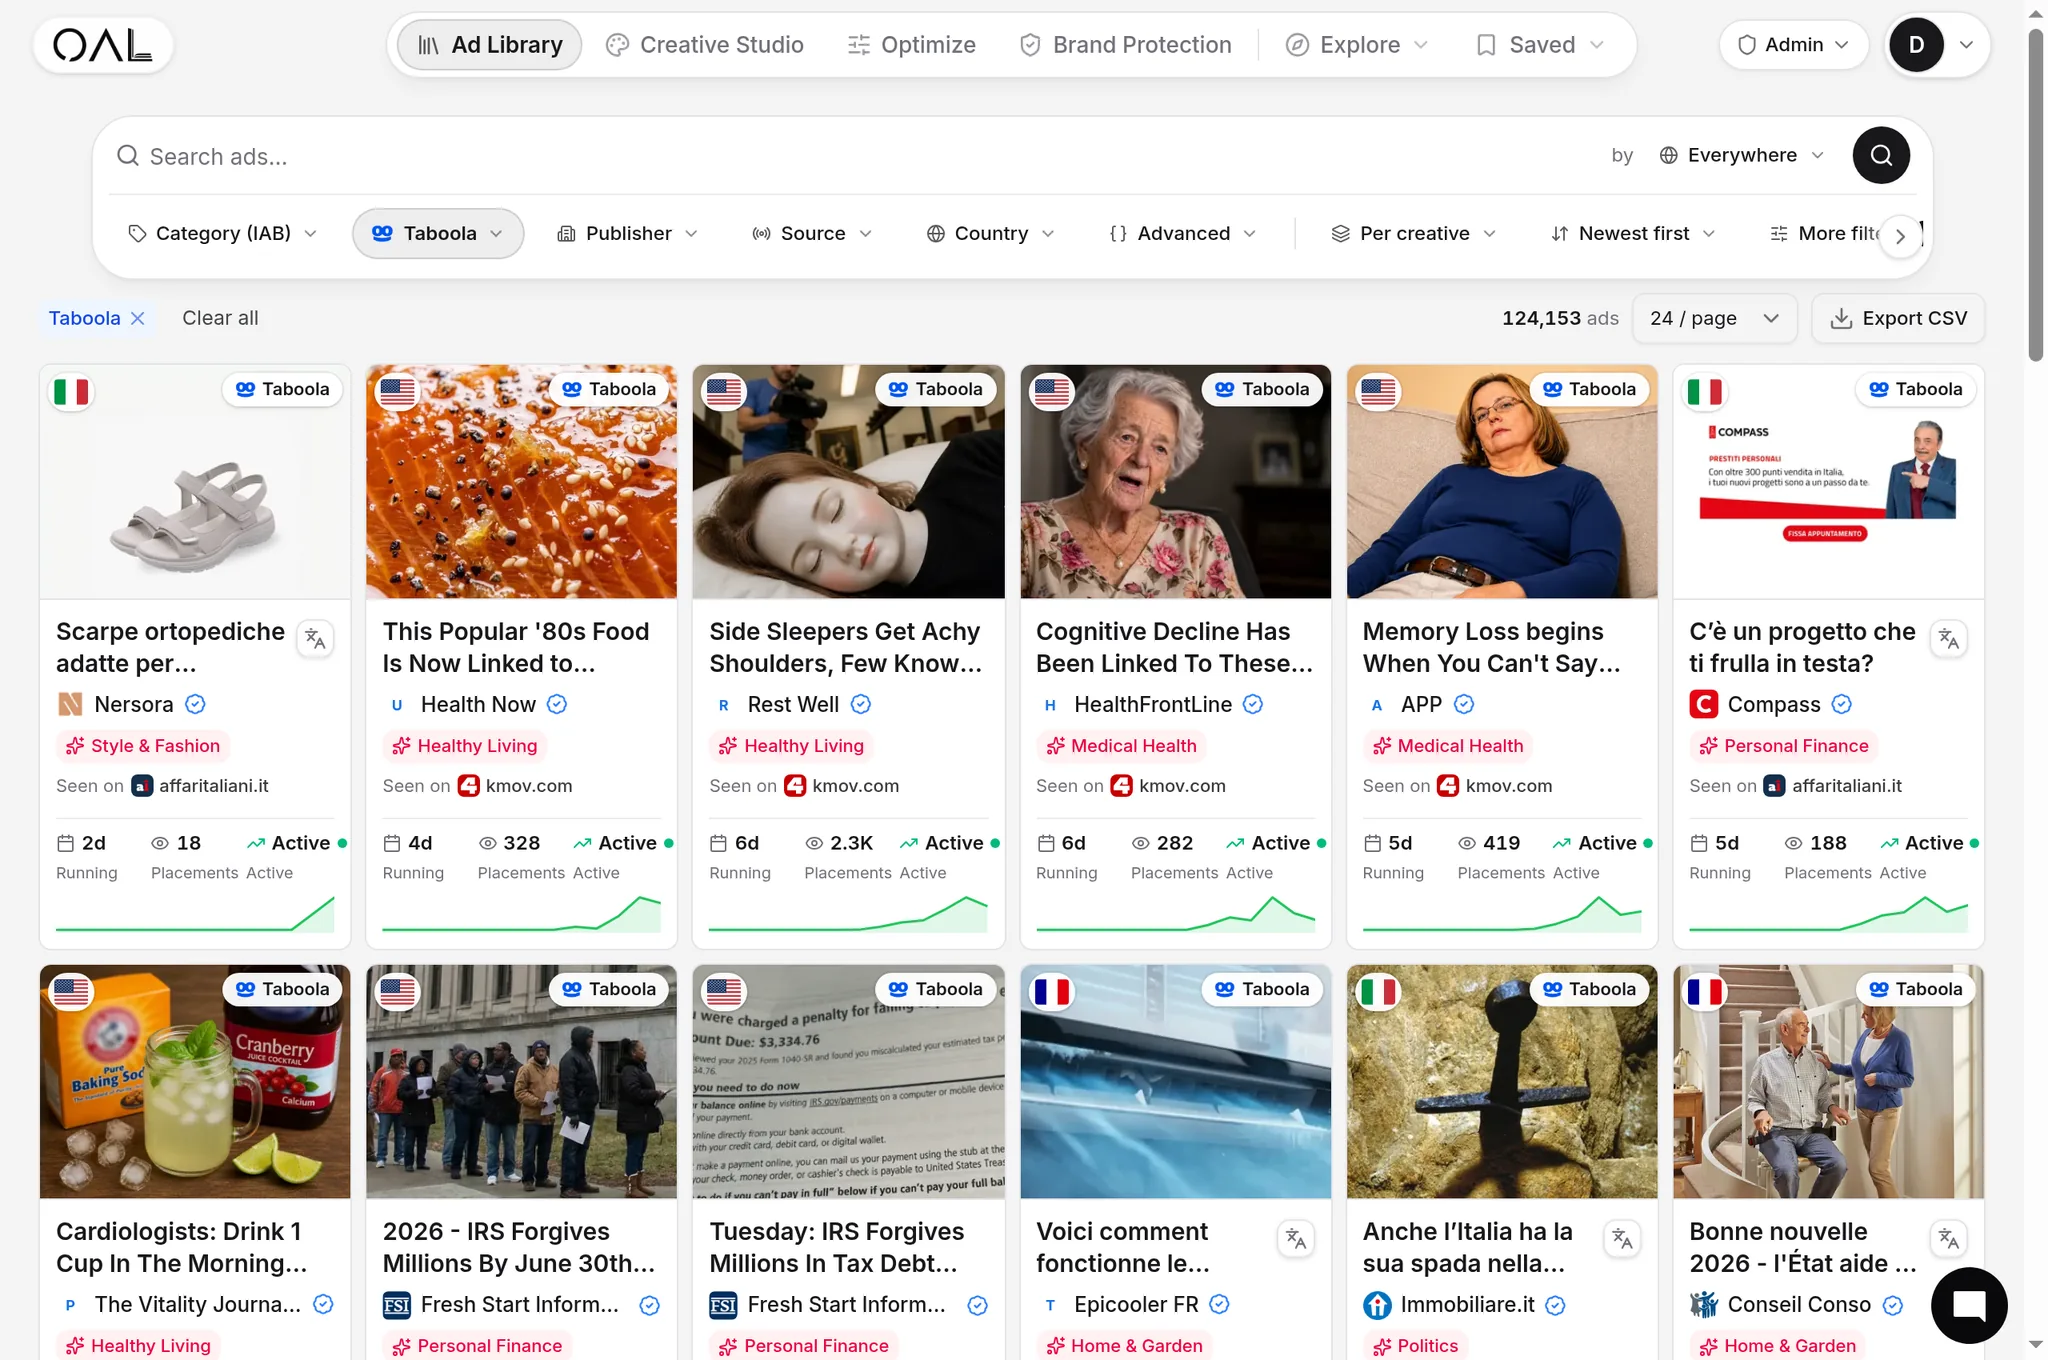
This is a data study, not a feature checklist. Vendor pages, forum CPC averages, and sales-team case studies will not tell you whether a network fits your offer. The live ad data will: who is actually advertising, how many creatives they ship, where the ads run, and how long they stay live. We track that on both networks. As of the June 2026 index, OpenAdLibrary has captured 157,727 Taboola creatives and 84,252 Outbrain creatives, part of 589,036 creatives and 5.4 million ad observations across 42 networks. Below is how to use signals like those to pick a network, plus what the numbers already say.
The short answer#
Taboola and Outbrain are still two separate buying platforms in 2026, but Outbrain is now owned by Teads after a roughly $900M to $1B acquisition and corporate rebrand completed in 2025. Taboola stays independent and exclusively powers Yahoo's native inventory under a 30-year deal. Neither network "wins" outright. In our own index Taboola carries almost twice the live creative volume of Outbrain (157,727 vs 84,252), which usually means more test traffic and cheaper benchmarks, but the right call depends on advertiser overlap, creative volume and publisher footprint in your specific vertical. Those are observable on live ads, unlike rate cards.
What changed in 2025 to 2026, precisely#
Getting the corporate structure right matters because it determines what you are actually buying.
| Dimension | Taboola | Outbrain (now under Teads) |
|---|---|---|
| Corporate status (2026) | Independent, publicly traded (Nasdaq: TBLA) | Outbrain acquired Teads (Feb 2025); parent renamed Teads Holding Co. (Nasdaq: TEAD), June 2025 |
| Flagship native product | Taboola native recommendation widgets | Outbrain native widgets, now packaged with Teads video and CTV |
| Headline distribution deal | 30-year exclusive deal powering Yahoo's native inventory | Combined Teads footprint across premium open-web publishers, plus video and CTV |
| Historical publisher tilt | Broad long-tail plus marquee partners | Premium, brand-name publishers |
| Live creatives in our index (June 2026) | 157,727 | 84,252 |
Two things follow. First, when you read older "Taboola vs Outbrain" content, read any claim about "Outbrain the company" as describing what is now Teads. Second, the Yahoo relationship is a genuine supply-side edge for Taboola. It handed Taboola exclusive access to Yahoo's native inventory on a long-term deal, which widens the audience a Taboola campaign can reach. For background on how these platforms are categorized, see our glossary entries on Taboola, Outbrain and Teads, and the broader definition of a native ad network.
One number is worth flagging on the Teads side. Despite the rebrand, the standalone Teads brand barely shows up as native inventory in our capture: just 55 Teads-tagged creatives versus tens of thousands each for Taboola and Outbrain. The Outbrain widget is still where the native demand lives. The "Teads" name is mostly a corporate and video-CTV story, not a native-feed one. Plan accordingly.
The cleanest way to hold it in your head: Taboola is the bigger, more independent long-tail network. The Outbrain product survives but reports up into a Teads parent that is steering its base toward video and CTV. Pick the network whose live advertiser mix matches your offer, not the one with the better landing page.
Where the demand actually sits, by vertical#
Headline creative counts only get you so far. What you really want is whether your vertical has depth on a network. Here is what our June 2026 index shows for the top categories on each.
| Vertical | Taboola creatives | Outbrain creatives |
|---|---|---|
| Health | 6,048 | 2,016 |
| Finance | 5,558 | 2,640 |
| Insurance | 4,303 | 2,615 |
| Ecommerce | 3,330 | 1,479 |
| Software | 2,206 | 1,197 |
| Home & garden | 2,630 | 1,091 |
Read the mix, not just the totals. Taboola leads with health, finance and insurance in that order. Outbrain leads with finance and insurance roughly tied, with health a notch behind. So if you run finance or insurance offers, the gap between the two networks is narrower than the overall 157k vs 84k split suggests. Outbrain's demand is more concentrated in those money verticals. If you run health, Taboola has roughly three times the creative depth, which means more competitors to learn from and more proven angles to model.
For the market as a whole, finance (17,232 creatives), insurance (15,629) and health (14,895) are the three deepest verticals we track, so the two networks are simply mirroring where native money goes. Here is a live finance ad from Taboola, the kind of tax-relief angle that dominates the category:

Why live ad data beats spec sheets#
A network comparison built on published rate cards and self-reported reach is built on the parts both companies most want to control. The honest signals are the ones neither vendor publishes.
- Advertiser overlap tells you whether the two networks fish the same pond. If the same advertisers in your vertical run on both, the networks compete for the same demand and your edge has to come from creative, not platform.
- Creative volume per advertiser is a proxy for commitment. An advertiser shipping dozens of distinct creatives is investing. One with a single stale image is not.
- Geo distribution shows where each network's inventory actually delivers, which rarely matches the "global reach" map in a deck.
- Publisher footprint reveals the type of sites your ad lands on, the single biggest driver of traffic quality on native.
- Creative longevity is the most underrated signal. An ad running unchanged for weeks is almost certainly profitable. Nobody pays to keep a loser live.
This is exactly what an ad-transparency platform captures. OpenAdLibrary catches live public native ads on Taboola, Outbrain, Teads and the mid-tier networks, stores the real creative at full quality, classifies the ad-tech supply chain behind each placement, and follows the click through to the advertiser's landing page or pre-lander without ever clicking the live ad. That last step matters: the destination tells you the offer, the funnel, and often the affiliate network behind a campaign.
A repeatable methodology for comparing the two networks#
Here is the analysis we run. It is structured so you can reproduce it for your own vertical.
1. Build a comparable advertiser set#
Filter captured ads to a single vertical and geo, say insurance offers in your market, then split by network. You now have two lists: advertisers seen on Taboola and advertisers seen on Outbrain. The intersection is your overlap set. A large overlap means the networks compete head-to-head for the same demand. A small overlap means each network has captured distinct advertisers, which is useful if you want buyers a competitor cannot reach. This insurance creative shows the localized angle that travels well on Taboola:

2. Measure creative volume and refresh rate#
For each advertiser in the overlap set, count distinct creatives per network over a fixed window, and watch how often new ones appear. An advertiser running 30 creatives on Taboola and 4 on Outbrain is telling you where their budget lives. Aggregate that across the vertical and you get a defensible read on which network the serious money in your niche prefers, independent of any rate card.
3. Map geo distribution#
For a sample of near-identical creatives on both networks, record the geos each was captured in. Networks differ sharply by region. A network that looks dominant in the US may be thin in the markets you care about. Geo data pulled from live delivery beats a coverage map every time.
4. Profile the publisher footprint#
Look at which publishers each network's ads actually appear on in your vertical. Outbrain's heritage is premium, brand-name publishers. Taboola spans a broader long-tail. Confirm it for your niche rather than assuming, because category and geo shift the mix a lot.
5. Trace the click to the landing page#
For your top overlap advertisers, follow the click path on each network to the destination. Are they sending the same landing page to both networks, or tailoring per network? The same pre-lander on both usually means the offer is portable and you can test it on either. Divergent funnels suggest the advertiser has learned the networks convert differently and built around it. Because the click trace also exposes the supply chain and any affiliate network in the path, you often learn who is actually monetizing the traffic.
What creative longevity already tells us#
Run that methodology on longevity and a pattern jumps out. The longest-running ads in our current index sit at about 28 days of continuous observation, and Outbrain holds several of them: SmartAsset's IRA-tax finance ad, a Combat Siege gaming ad, and Cleverst's pets-curiosity ad have all been observed running unchanged for the full 28 days. On Taboola, a Nebroo hearing-aids creative has held for 26 days and a solar-battery subsidy ad for 27. Those are the proven angles in their niches.

A caveat worth stating plainly. Our index currently spans up to roughly 28 days of continuous observation per creative, so "28 days" is the ceiling of what we have watched, not a claim the ad has run that long and no longer. The old affiliate lore about "90-day winners" is general industry folklore, useful as a mental model but not something our data measures. What our data does measure is which ads survive the windows we watch. That is enough to spot the durable creatives worth modeling.

How to read the results#
The output of that methodology is not a verdict. It is a decision framework tuned to your situation.
- Heavy overlap, higher creative volume on Taboola means committed buyers in your niche concentrate there. You will likely find cheaper test traffic and more comparable benchmarks. Start there, port winners to Outbrain later.
- Low overlap, distinct advertisers on each means the networks reach different audiences. Running both may be worth it to avoid leaving demand on the table.
- Premium-publisher-heavy footprint on Outbrain in your geo means that if brand-safe placement and premium context matter for your offer, Teads-owned inventory may justify a higher effective cost.
- Long-running, unchanged creatives on either network are your proven angles. Model the structure, not the copy, and validate against longevity before committing budget.
For where these two sit against the rest of the market, our ranking of the best native ad networks in 2026 puts them in context by real ad volume. If your budget points down-market, the same methodology works on the mid-tier: see Revcontent vs Taboola for the reach-and-cost trade-off and MGID vs Taboola for the budget question. For hard cost expectations, pair this with our native ads CPC benchmarks and the broader native ad cost budgeting guide.
Where the public tools fail, and what to use instead#
Both Taboola and Outbrain run official ad libraries and transparency pages, and they are worth knowing about. But they are built for compliance, not competitive analysis. They show ads in isolation, do not unify advertiser identity across creatives, rarely preserve the full-quality creative, and never trace the click to the landing page. You cannot easily answer "how many creatives is this advertiser running" or "what offer is behind this ad" from a first-party transparency page.
The traditional alternative is a paid spy tool, and the established ones are expensive. Adbeat runs around $399 a month and AdPlexity's native module sits near $249 a month at list price. Those tools are capable, but the cost puts systematic cross-network analysis out of reach for most solo buyers and small teams, and many still lean on modeled estimates rather than the captured creative.
OpenAdLibrary takes the open, low-cost position. It captures the live creative at full quality, resolves the real advertiser behind each ad, classifies the supply chain, and follows the click to the destination, across Taboola, Outbrain, Teads and the mid-tier networks in one place. The free tier lets you browse 200 ads with no card, and full access is $29.99 a month rather than the $80 to $400 range of legacy rivals. Here is the kind of home-improvement angle you will find sitting in the Taboola feed, running 27 days:

You can start a vertical comparison directly from the Taboola ad spy view, then jump to Creative Studio, Optimize and Copy DNA to turn what you find into your own tests.
The bottom line for 2026#
Taboola versus Outbrain is now, more precisely, Taboola versus an Outbrain product owned by Teads. Taboola stays independent with the Yahoo distribution advantage and a broad long-tail, and it carries nearly double Outbrain's live creative volume in our index. The Outbrain native product continues but as one part of a Teads omnichannel push toward video and CTV, with the standalone Teads brand barely registering as native inventory yet. None of those facts, on their own, tells you where to spend. The advertiser overlap, creative volume, geo and publisher signals in your specific vertical do, and unlike rate cards, those signals are observable on live ads right now.
Start free and run the comparison on your own vertical: browse 200 ads with no card, see the real advertisers and creatives on both networks, and trace each click to the landing page before you commit a dollar of test budget.