Native Ads CPC Benchmarks 2026: Taboola, Teads, MGID, Revcontent
Published CPC ranges for Taboola, Teads, MGID, and Revcontent only tell half the story; here is how to read live advertiser density and longevity to know what a click is really worth before you fund a test.
Most "native ads CPC benchmark" pages hand you one number per network and walk away. That number is close to useless on its own. Native CPC is an auction outcome, blended across thousands of publishers, every device, every geo tier, and dozens of verticals. A $0.40 "average" Taboola click hides the chasm between a Tier-3 content slot and a Tier-1 finance placement where the identical click can cost five times more.
So this study does two jobs. First, it consolidates the published 2026 CPC ranges that reputable sources report for Taboola, Teads (formerly Outbrain), MGID, and Revcontent. Second, and this is the part you can actually act on, it shows you how to read the competition signals that explain why a CPC lands where it does, using the live ads we capture at OpenAdLibrary. We do not invent numbers. Published ranges are cited as ranges. The OpenAdLibrary figures are real counts from our index as of June 2026.
For context on scale: our index currently holds 589,036 captured creatives from 25,933 distinct advertisers across 42 networks, with 926,259 landing-page captures behind them. That is the dataset doing the talking below.
What native CPC benchmarks actually tell you in 2026#
A native CPC benchmark is the auction-clearing price of a click on discovery and content-recommendation networks. In 2026, published ranges cluster around roughly $0.20 to $0.90 on premium networks (Taboola, Teads) and lower entry points on mid-tier networks (MGID, Revcontent). But the real figure you pay depends on your geo tier, device, and vertical. Treat any single number as a starting range, then pressure-test it against live competition data.
Benchmarks scatter so wildly because of how the auction works. Native advertising runs a second-price-style auction across a long tail of publisher inventory. Your effective CPC moves with four things:
- Geo tier. Tier-1 markets (US, UK, CA, AU, DE) routinely clear at 2x to 5x the cost of Tier-2 and Tier-3 inventory for the same vertical.
- Device. Desktop placements usually clear higher than mobile on the premium networks.
- Vertical competition. Finance, insurance, and supplement offers bid against deep-pocketed arbitrageurs. Lighter content verticals do not.
- Creative quality. A better creative earns a higher CTR, which lowers your effective CPC at the same bid. Two advertisers in the same auction rarely pay the same price.
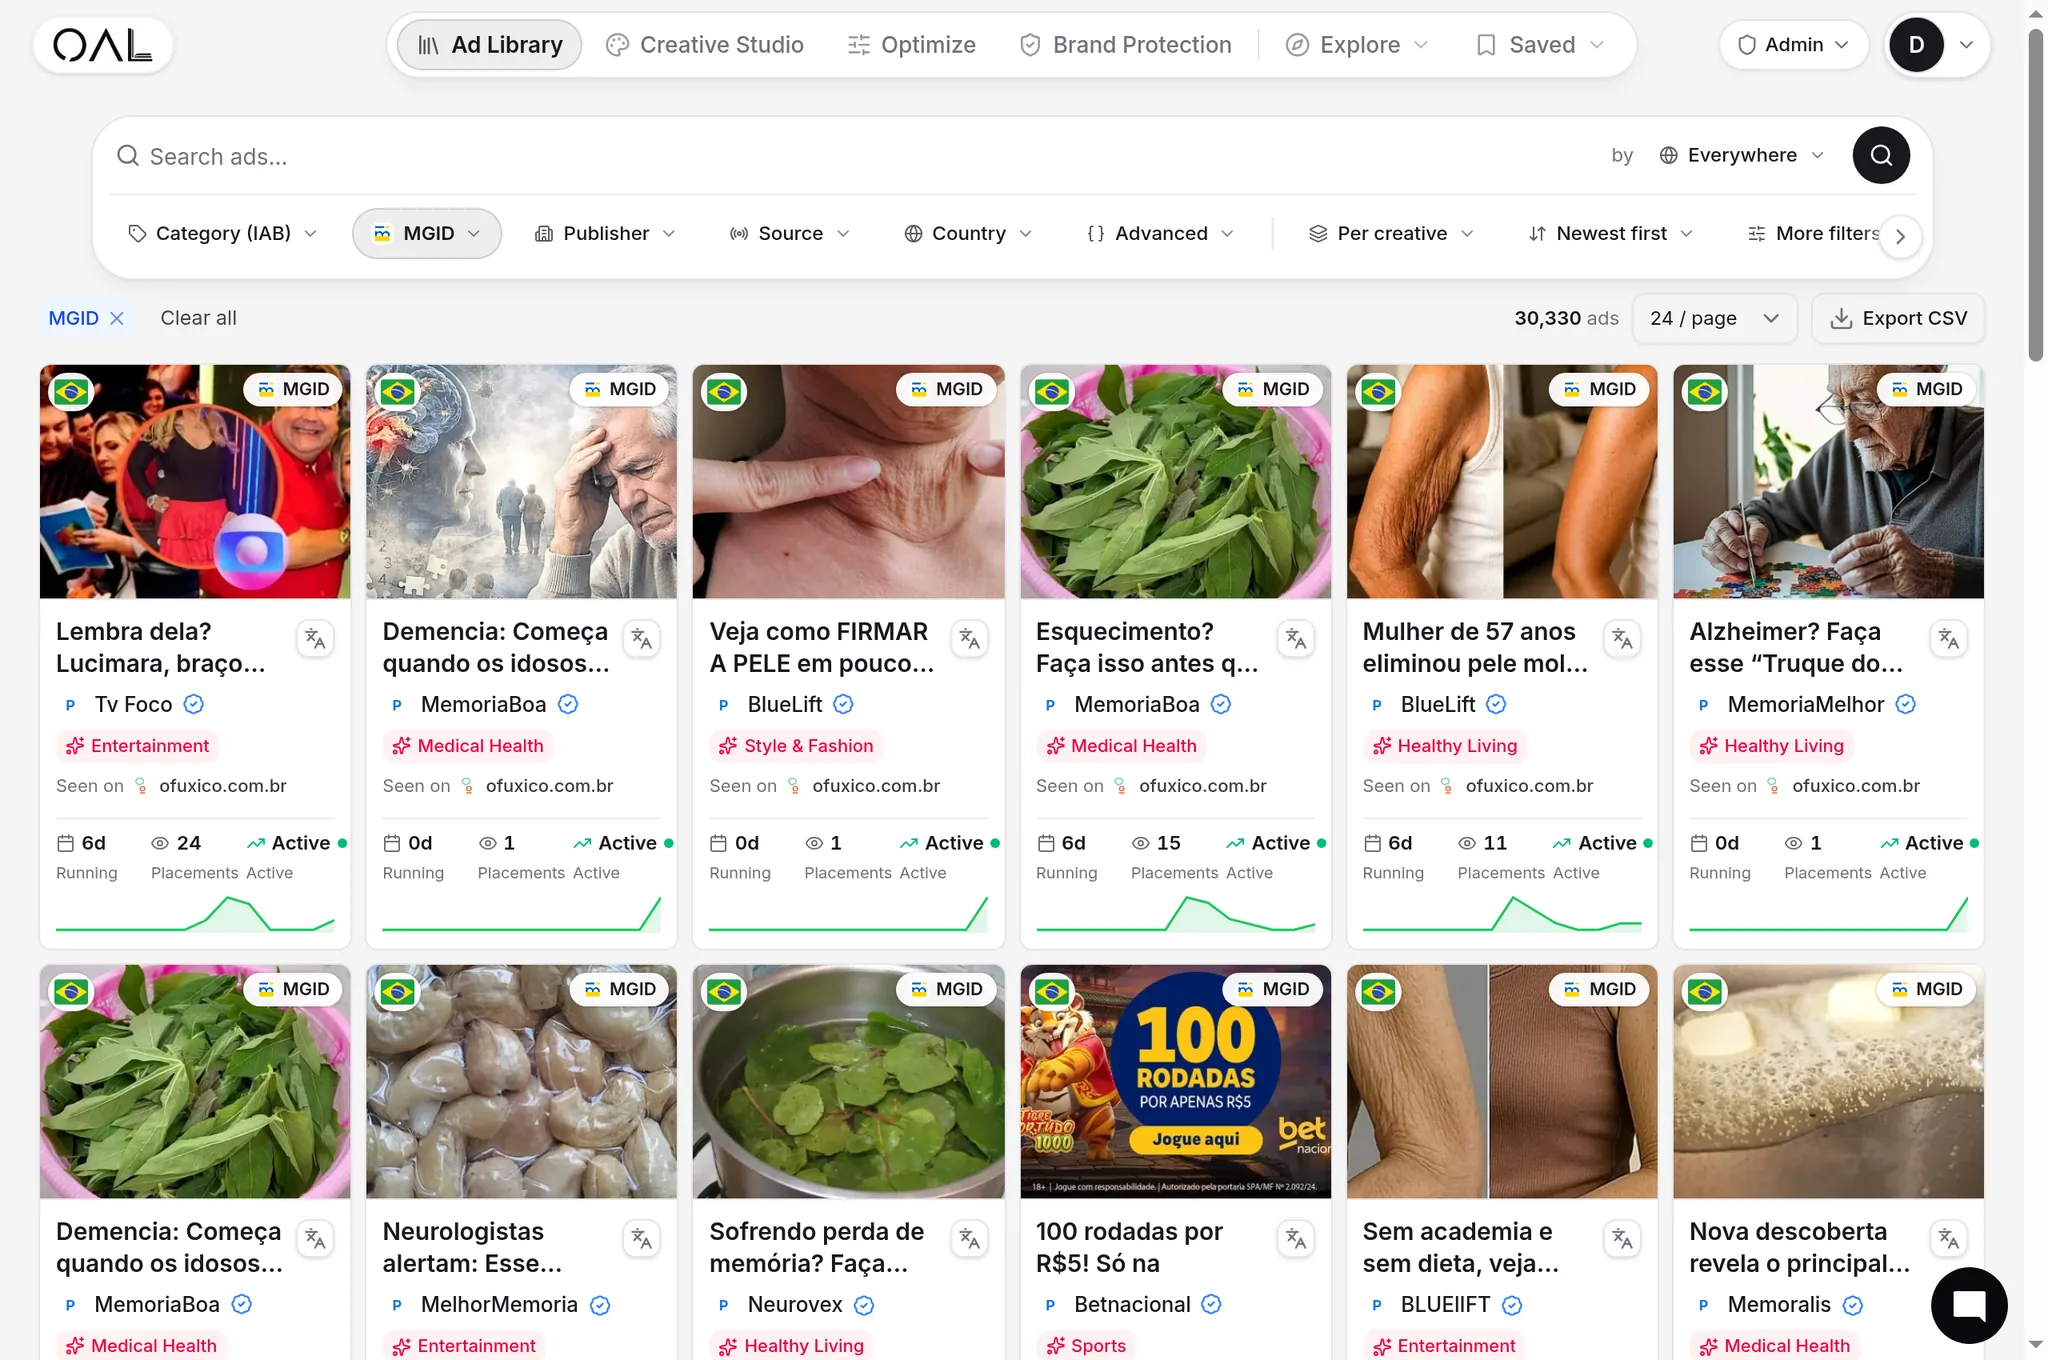
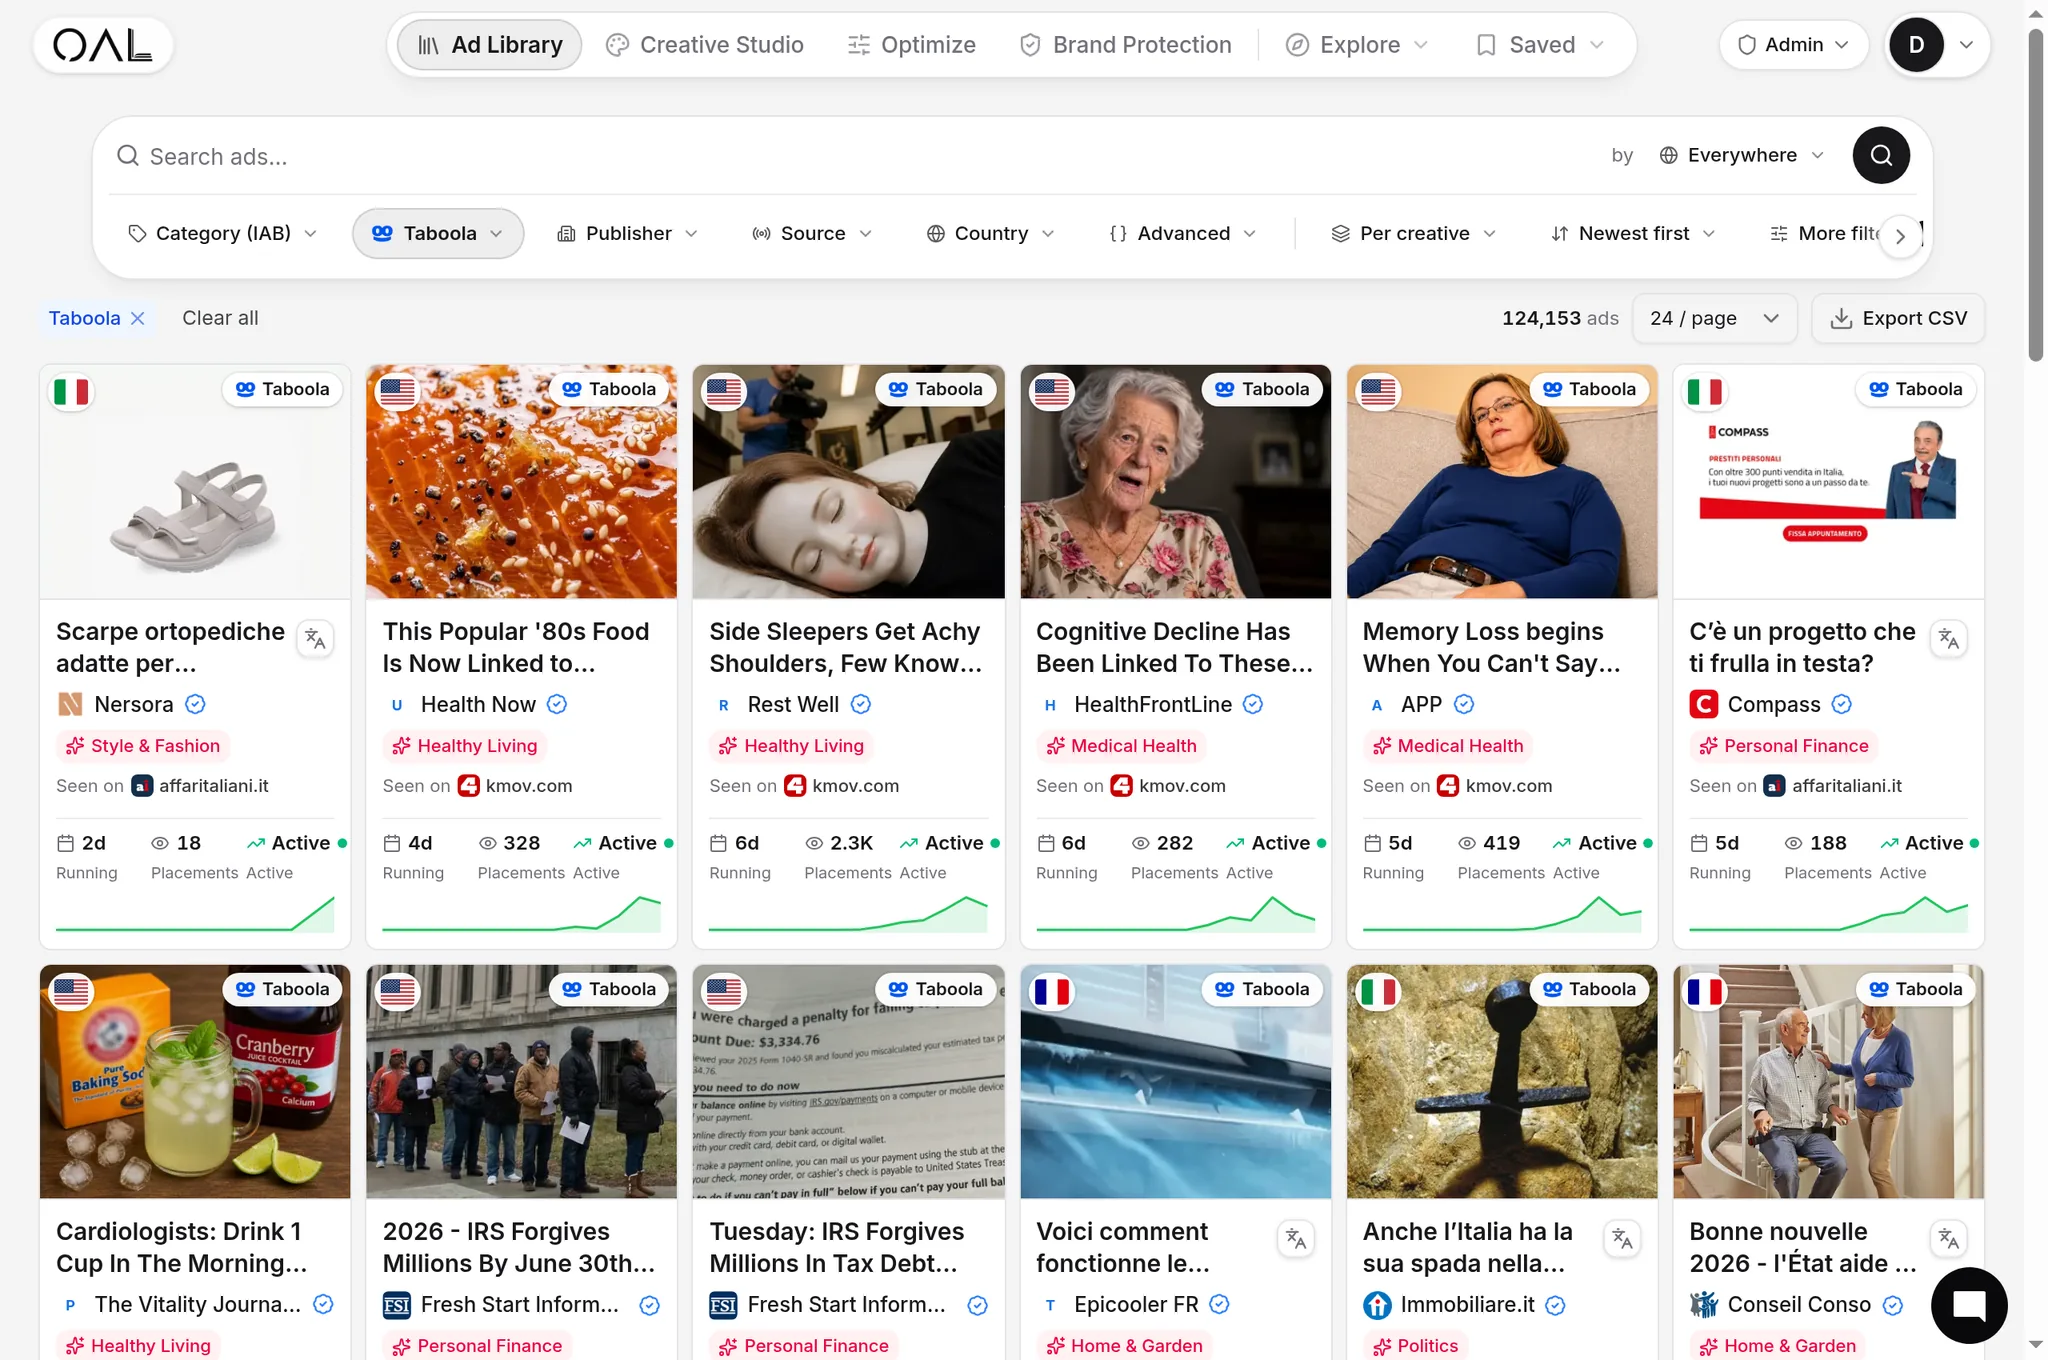
That last point is why a benchmark and your reality can diverge by a mile. The published number is a population average. Your number is set by who else is bidding and how good your ad is. Here is what a real, currently-live Taboola finance ad looks like in our index, the kind of creative that sets the price in a crowded auction:

Finance is the single most contested native vertical we track: 17,232 live creatives across all networks, ahead of insurance at 15,629 and health at 14,895. When you read a "premium network" CPC range, you are mostly reading the price of slices like that one.
Published 2026 CPC ranges by network#
The table below consolidates ranges reported by native-advertising publications and network documentation for 2026. These are published ranges, not forecasts. Use them to size a test, not to predict your account.
| Network | Typical published CPC range (Tier-1) | Position | Notes |
|---|---|---|---|
| Taboola | ~$0.30 to $0.70 | Premium, largest reach | Mobile generally cheaper than desktop; broad placements can dip lower |
| Teads (ex-Outbrain) | ~$0.20 to $0.80+ | Premium | Competitive niches and premium placements can exceed $1.00 |
| MGID | ~$0.01 to $0.15 entry | Mid-tier | Lowest entry CPC; higher for Tier-1 traffic |
| Revcontent | ~$0.10 to $0.50 | Mid-tier | Varies sharply by target geo |
One thing the table cannot show you, but our index can: reach is not evenly distributed. Of the four networks here, Taboola dominates what we observe by a wide margin, 157,727 captured creatives versus 49,689 for MGID and 11,478 for Revcontent. If a network's published CPC looks attractive but almost nobody is buying it at scale, that is a signal worth more than the price tag.
A note on Teads, because it changes how you read older data. Outbrain completed its acquisition of Teads in February 2025, renamed the parent to Teads Holding Co., and began trading under the ticker TEAD on Nasdaq on June 10, 2025. The combined advertiser product now runs under the Teads brand. So when you find a 2023 or 2024 "Outbrain CPC" figure, read it as Teads going forward. The auction and inventory it describes are now part of the same platform. (Worth knowing: a lot of the post-merger inventory still reports to us under the Outbrain network label, which is why our standalone "Teads" creative count sits at just 55 while Outbrain-tagged volume stays heavy. The brand changed faster than the plumbing.) We dig into the consolidation in our Taboola vs Outbrain (now Teads) comparison, and the mid-tier dynamics in MGID vs Revcontent.
The pattern holds across every credible source. Premium networks charge more per click and deliver more curated, brand-safe inventory. Mid-tier networks advertise lower CPCs that stretch a test budget further but demand harder filtering for traffic quality. Neither is "cheaper" once you account for conversion rate, which is exactly why CPC alone is the wrong place to stop.
Why a CPC benchmark is only half the answer#
A benchmark tells you the price of a click. It tells you nothing about whether anyone is winning at that price.
Here is the trap. You read that MGID clears at a few cents and Taboola clears at fifty. The naive read is "MGID is 10x cheaper." But CPC is the cost of a click, not the cost of a customer. If the cheap geo converts at a tenth of the rate, the cheap click is the expensive one. To benchmark with any intelligence you need a second axis the published numbers never give you: how competitive and how proven is the exact slice you are about to buy?
That second axis is observable without spending a dollar, because it lives on the supply side, in the ads already running. Three signals matter.
Advertiser density. How many distinct advertisers are live in your vertical, on this network, in this geo? More advertisers means a hotter auction and firmer CPCs. It also means the slice is proven enough to attract them. On Taboola alone, our top three verticals by live creative volume are health (6,048), finance (5,558), and insurance (4,303). Those are the rooms where the auction runs hot.
Creative spread. How many distinct creatives is each advertiser rotating? Heavy rotation signals an account that is actively testing and scaling, not running a one-off probe.
Longevity. How long has a given creative been live? A native ad that has run for weeks is, by definition, paying for itself. Nobody buys clicks indefinitely to lose money.
A caveat on longevity, because the industry repeats a number that is not ours. You will hear that "winning native ads run 90 days or more." That may well be true of the broader market. It is not something we have personally observed end to end. Our continuous-observation window currently spans up to about 28 days per creative, and we have a healthy cluster of ads sitting right at that 28-day ceiling, hearing-aid offers, IRA-tax advertorials, IQ-quiz funnels, that we have watched run without a break the entire time. When we say "long-running," we mean what we have actually seen, not folklore.
Cross those three signals against the published CPC range and the benchmark finally means something. A $0.60 Taboola CPC in a geo with twelve active finance advertisers running long-lived creatives is a completely different proposition from the same $0.60 in a geo with two advertisers churning ads weekly.

That hearing-device ad has been live for 26 days in our index. Health is Taboola's single largest vertical for a reason: the offers convert, the creatives survive, and the auction stays warm. A 26-day survivor is your benchmark for what a winning click in that slice actually costs.
How to run this analysis yourself#
This is the method, step by step. You can do a rough version by hand, scrolling publisher sites and eyeballing what repeats. You do it precisely with a native ad spy tool that captures live ads and traces each one to its destination. OpenAdLibrary captures live public native ads across Taboola, Teads, MGID, Revcontent, and more, stores the real creative at full quality, classifies the ad-tech supply chain behind each placement, and follows each click through to the advertiser's landing page, all without clicking live ads. That last capability is what turns "I see an ad" into "I know who runs it and where it lands."
Step 1: Fix your slice. Pick one network, one geo, one vertical. Benchmarks are meaningless blended; competition is meaningful only when scoped. "Taboola, US, weight-loss supplements" is a slice. "Native ads, global" is noise.
Step 2: Count advertiser density. Filter live ads to your slice and count distinct advertisers. Because each captured ad is traced to its real landing page, you are counting actual advertisers, not duplicate placements of the same offer. This is your competition proxy. Higher density usually correlates with firmer CPCs near the top of the published range.
Step 3: Read creative spread and longevity. For the top advertisers, look at how many creatives each rotates and how long the oldest ones have been live. Long-lived, heavily-rotated creatives mark proven winners. In our index right now, a real example: the home-energy advertiser below has had this solar-battery creative live for 27 straight days, nearly the full length of our observation window. An advertiser holding one angle that long has found fit and is paying a competitive CPC happily. That tells you what a winning click costs in that slice.

Step 4: Map the supply chain and landing page. Follow the traced click to the pre-lander or landing page. The angle, the offer, and the funnel structure tell you what the winning CPC is actually buying. A high CPC funding a strong advertorial-to-offer flow is healthier than a low CPC funding a thin page.
Step 5: Model CPC against your own funnel. Now combine the published CPC range (price of a click) with your expected conversion rate and target CPA. The benchmark sets the entry cost. The competition signals tell you whether that cost is sustainable. Your funnel math tells you whether to enter at all.
This is the analysis that separates a budgeting guess from a buying decision. For the budgeting side specifically, minimum spends, deposits, and how to phase a test, see How Much Do Native Ads Cost. For choosing the network in the first place, our pillar ranks the best native ad networks by real ad volume rather than by marketing claims.
Reading CPC by geo tier#
Geo is the single biggest mover of native CPC, and it is where blended benchmarks mislead most. The same vertical on the same network can swing hard.
- Tier-1 (US, UK, CA, AU, DE): Highest CPCs, deepest advertiser pools, most competition. The published premium-network ranges above are essentially Tier-1 ranges. Expect the top of the range here.
- Tier-2: Materially cheaper clicks, often half of Tier-1 or less, with thinner but still meaningful competition. A good place to validate creative before paying Tier-1 prices.
- Tier-3: Lowest CPCs, but conversion intent and traffic quality vary widely. Cheap clicks only win if your offer monetizes the audience.
Geo also shapes what you see in the wild. Plenty of the live creatives we capture are localized: the life-insurance ad below targets Australia specifically, the kind of Tier-1 insurance placement that sits near the top of the published range.

The actionable move is to apply the five-step method per tier. Count advertiser density in Tier-1 versus Tier-2 for your vertical. If Tier-1 is dense and Tier-2 is nearly empty, that asymmetry tells you where the proven money is, and whether a cheaper Tier-2 CPC reflects genuine opportunity or just an unvalidated market. The benchmark gives you the price; the density read gives you the meaning.
What to do with this#
Stop treating a native CPC number as an answer. It is one input. The published 2026 ranges, roughly $0.20 to $0.90 on Taboola and Teads, lower entry points on MGID and Revcontent, all swinging hard with geo and vertical, are the correct starting frame. The decision comes from layering live competition signals on top: who is running, how many creatives, how long, and where the clicks land.
That is the whole premise behind OpenAdLibrary as an open, affordable alternative to the $80 to $400 a month legacy spy tools. It captures the live ads (589,036 creatives and counting), identifies the real advertiser behind each one, traces the click to the landing page, and surfaces the longevity and spread signals that reveal which offers are actually winning. A benchmark becomes a buying decision instead of a guess. Start free and run the five-step analysis on your own network-and-geo slice before you fund a single test.