How to Do Competitor Ad Analysis: A Step-by-Step Framework (2026)
A practitioner's four-stage framework for turning a competitor's live native ads into a ranked list of winning angles, a relative-spend estimate, and a creative backlog you can test next week.
Most "competitor ad analysis" is just opening a rival's site, glancing at whatever ad happens to load, and saving a screenshot to a folder nobody reopens. That is reconnaissance. It is not analysis. Analysis means turning a stream of live ads into decisions: which angle to copy, which offer to undercut, where to put your next test dollar.
This is the framework I use for native campaigns. Four stages: build a watchlist, pull live ads, score the creatives, infer relative spend. Each stage spits out something you actually use, not a deliverable that dies in a slide deck. I'll use real Taboola and Outbrain captures from our own index as worked examples, because native is where this discipline pays off hardest. The creatives are cheap to copy, the offers are aggressive, and the winners hide in plain sight on publisher pages you'd never think to check.
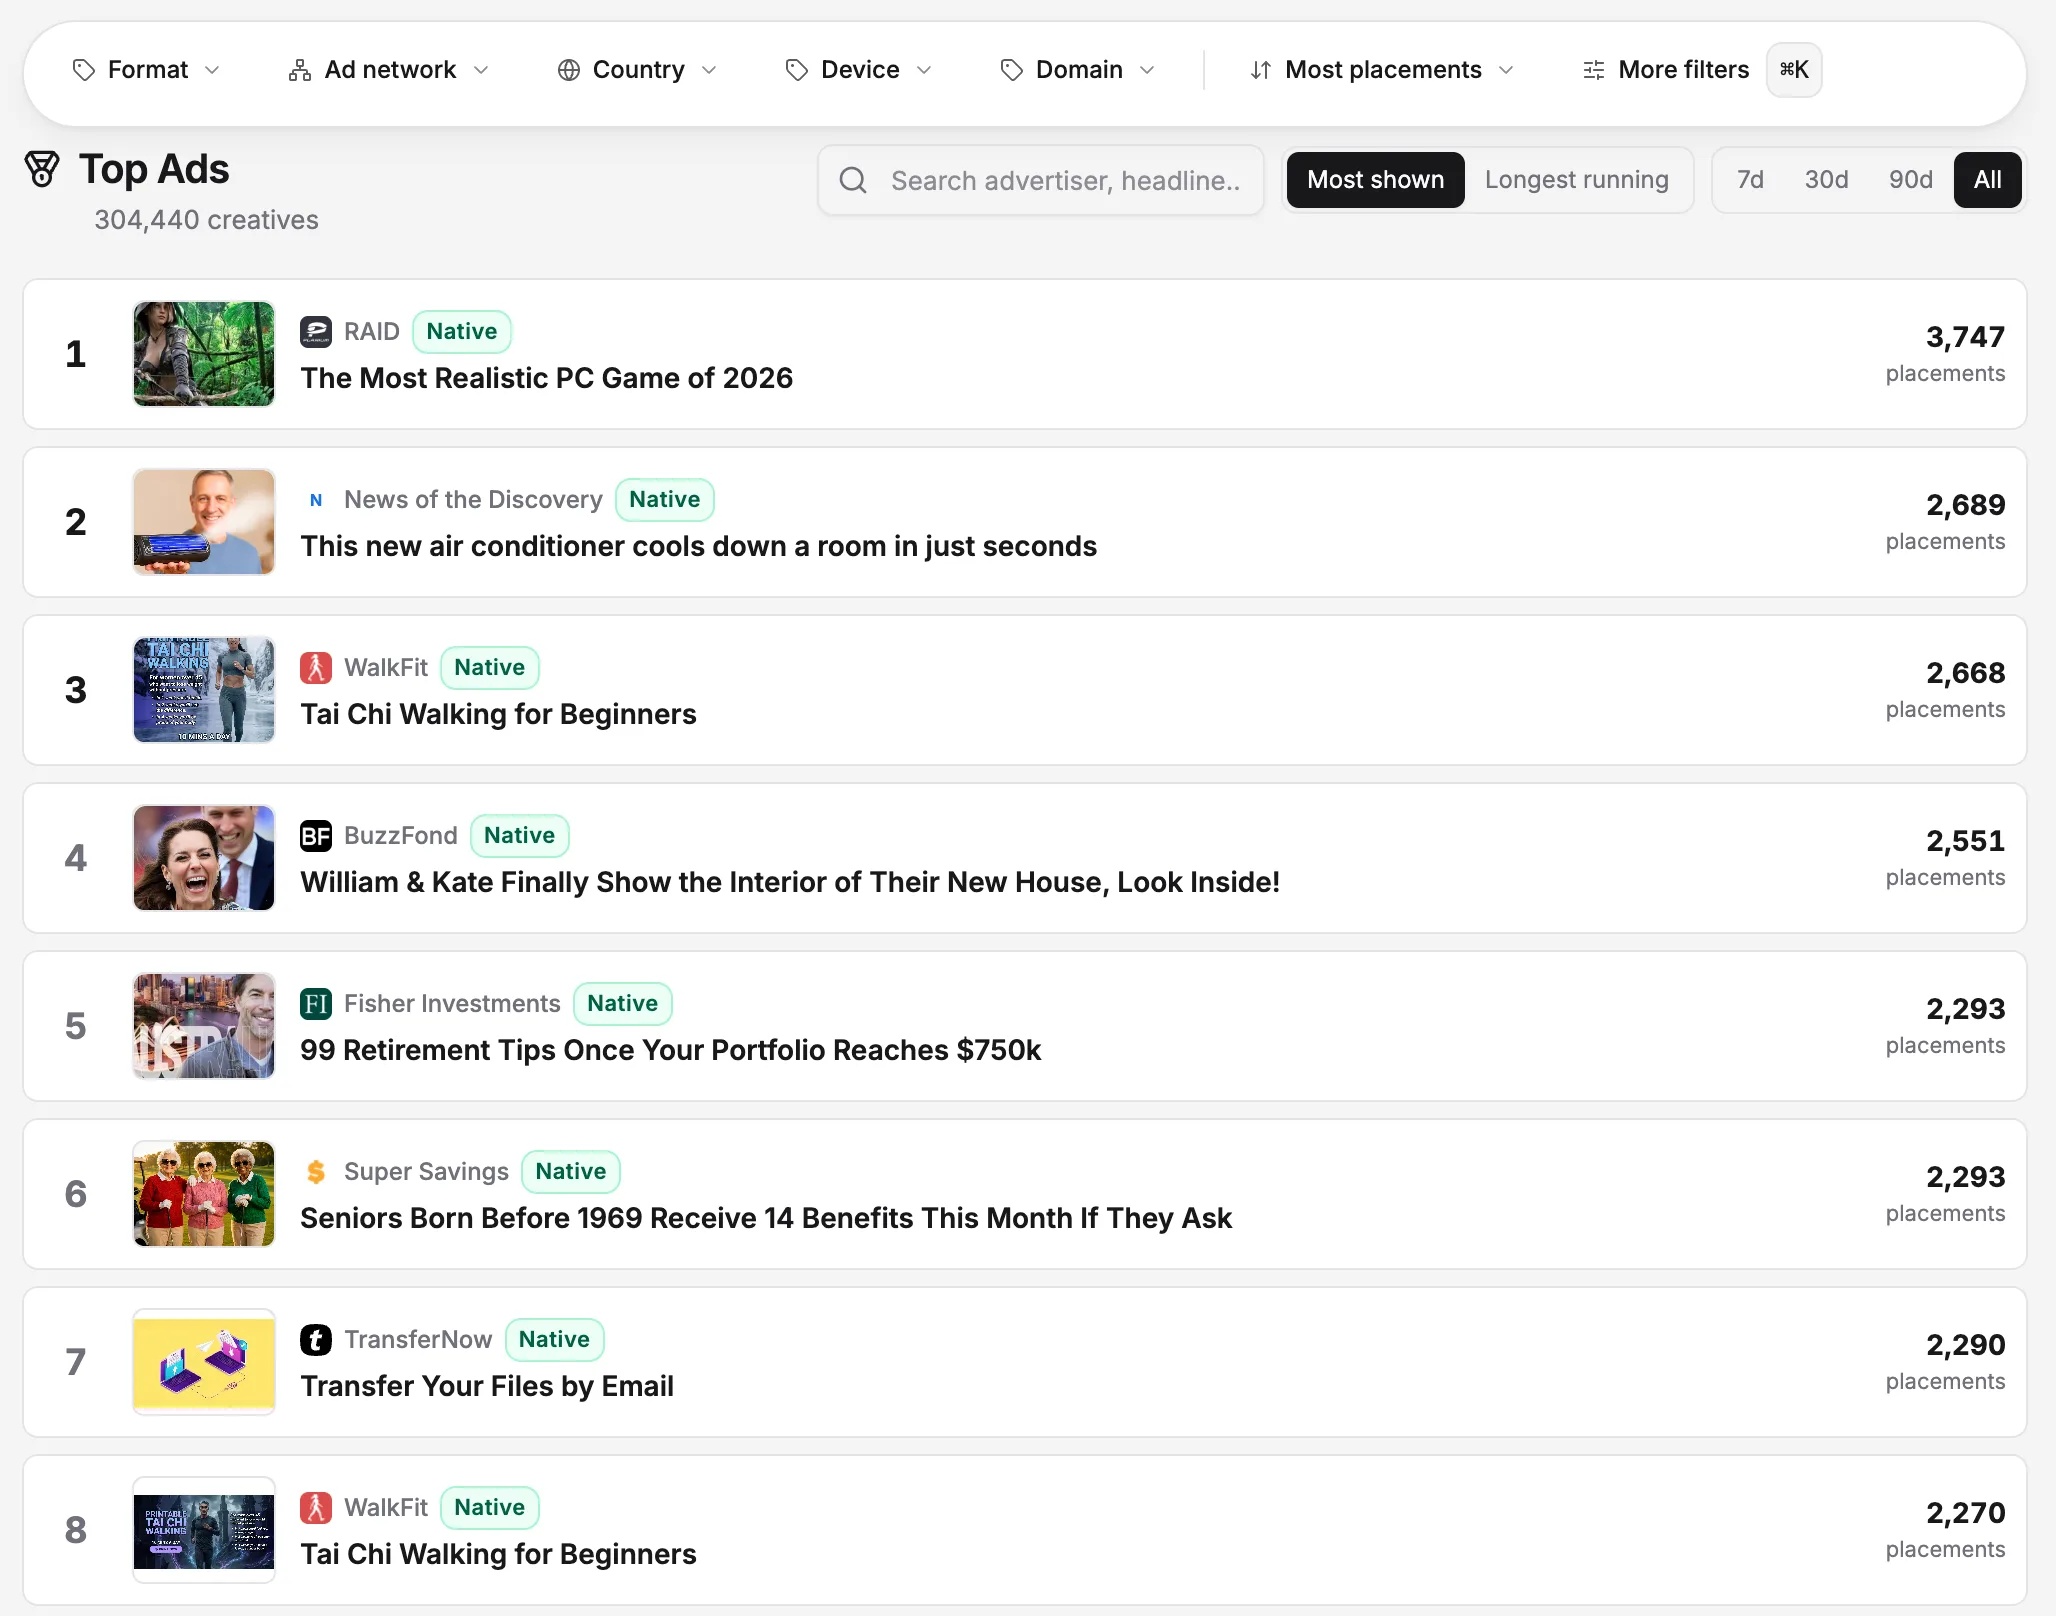
For scale, here's what one slice of the open web looks like right now: we've captured 589,036 creatives from 25,933 advertisers across 42 networks (OpenAdLibrary index, June 2026). Taboola alone accounts for 157,727 of those creatives, Outbrain for 84,252. That is the haystack. The framework below is how you pull signal out of it.
What competitor ad analysis actually delivers#
Competitor ad analysis is the systematic study of the ads a rival runs (creatives, offers, placements, and how long each stays live) to infer what works for them and where you can win. The output is not a screenshot folder. It's a ranked list of proven angles, a relative-spend estimate built from public signals, and a prioritized creative backlog you can test next week.
That definition sets the bar. If your process ends with "here are their ads," you did recon. If it ends with "here are three angles outperforming everything else, here's who's spending more than us and where, and here are the five creatives we test first," you did analysis. The four stages get you to the second outcome. If you want the wider context across native, display and social, the competitor ad spying pillar guide frames where this fits.
Stage 1: Build a watchlist worth watching#
Everything downstream depends on monitoring the right set of advertisers. Too broad and you drown in noise. Too narrow and you miss the rival quietly stealing your best customers.
Build three tiers:
- Direct competitors. Companies selling the same thing to the same buyer. Obvious, but be specific: include the brand names and the shell or affiliate entities they run ads under, which often differ from the corporate name.
- Category leaders. The biggest spenders in your vertical, even a size up from you. They fund the most creative testing, so they surface winning angles first. You copy the angle, not the budget.
- Aggressive affiliates. The lean operators who live and die on native ROI. They iterate fastest and have zero brand restraint, which makes them the best early read on what's converting right now.
The most valuable advertiser on your watchlist is rarely your named competitor. It's the affiliate three steps ahead of you who already burned through the losing angles and only runs winners, because their margin doesn't survive anything else.
For each entry, record the real advertiser entity, the landing domains they use, and the networks you've seen them on. The "real advertiser" part is harder than it sounds in native. Ads route through tracking redirects, and the brand displayed on the creative often isn't the entity paying for it. A platform that resolves the actual advertiser behind each placement saves you hours of manual redirect-chasing. If watchlist construction is where you want to go deep, the watchlist-to-action workflow covers tiering and maintenance in more detail.
Stage 2: Pull live ads, the evidence layer#
A watchlist is useless without a steady feed of what those advertisers are actually running. This is where most DIY processes break. Manually refreshing publisher pages to catch a competitor's ad is slow, geo-dependent, and misses everything served outside your own browsing session.
You need a source that captures live, public native ads continuously, across publishers and geographies, and stores the real creative, not a thumbnail. The non-negotiables:
- Live capture, not a stale archive. A library that last refreshed weeks ago tells you what ran, not what's running. Recency is the whole point.
- Full-quality creative. You're going to study the image, the headline framing, the thumbnail composition. A blurry crop is evidence you can't read.
- The supply chain, classified. Knowing an ad ran on Taboola vs. Outbrain (now operating as Teads after the two merged in early 2025) vs. MGID tells you which auctions your competitor is buying into.
- The click traced to the landing page. The creative is the hook. The landing page is where the money is made. Analysis that stops at the ad image misses half the funnel.
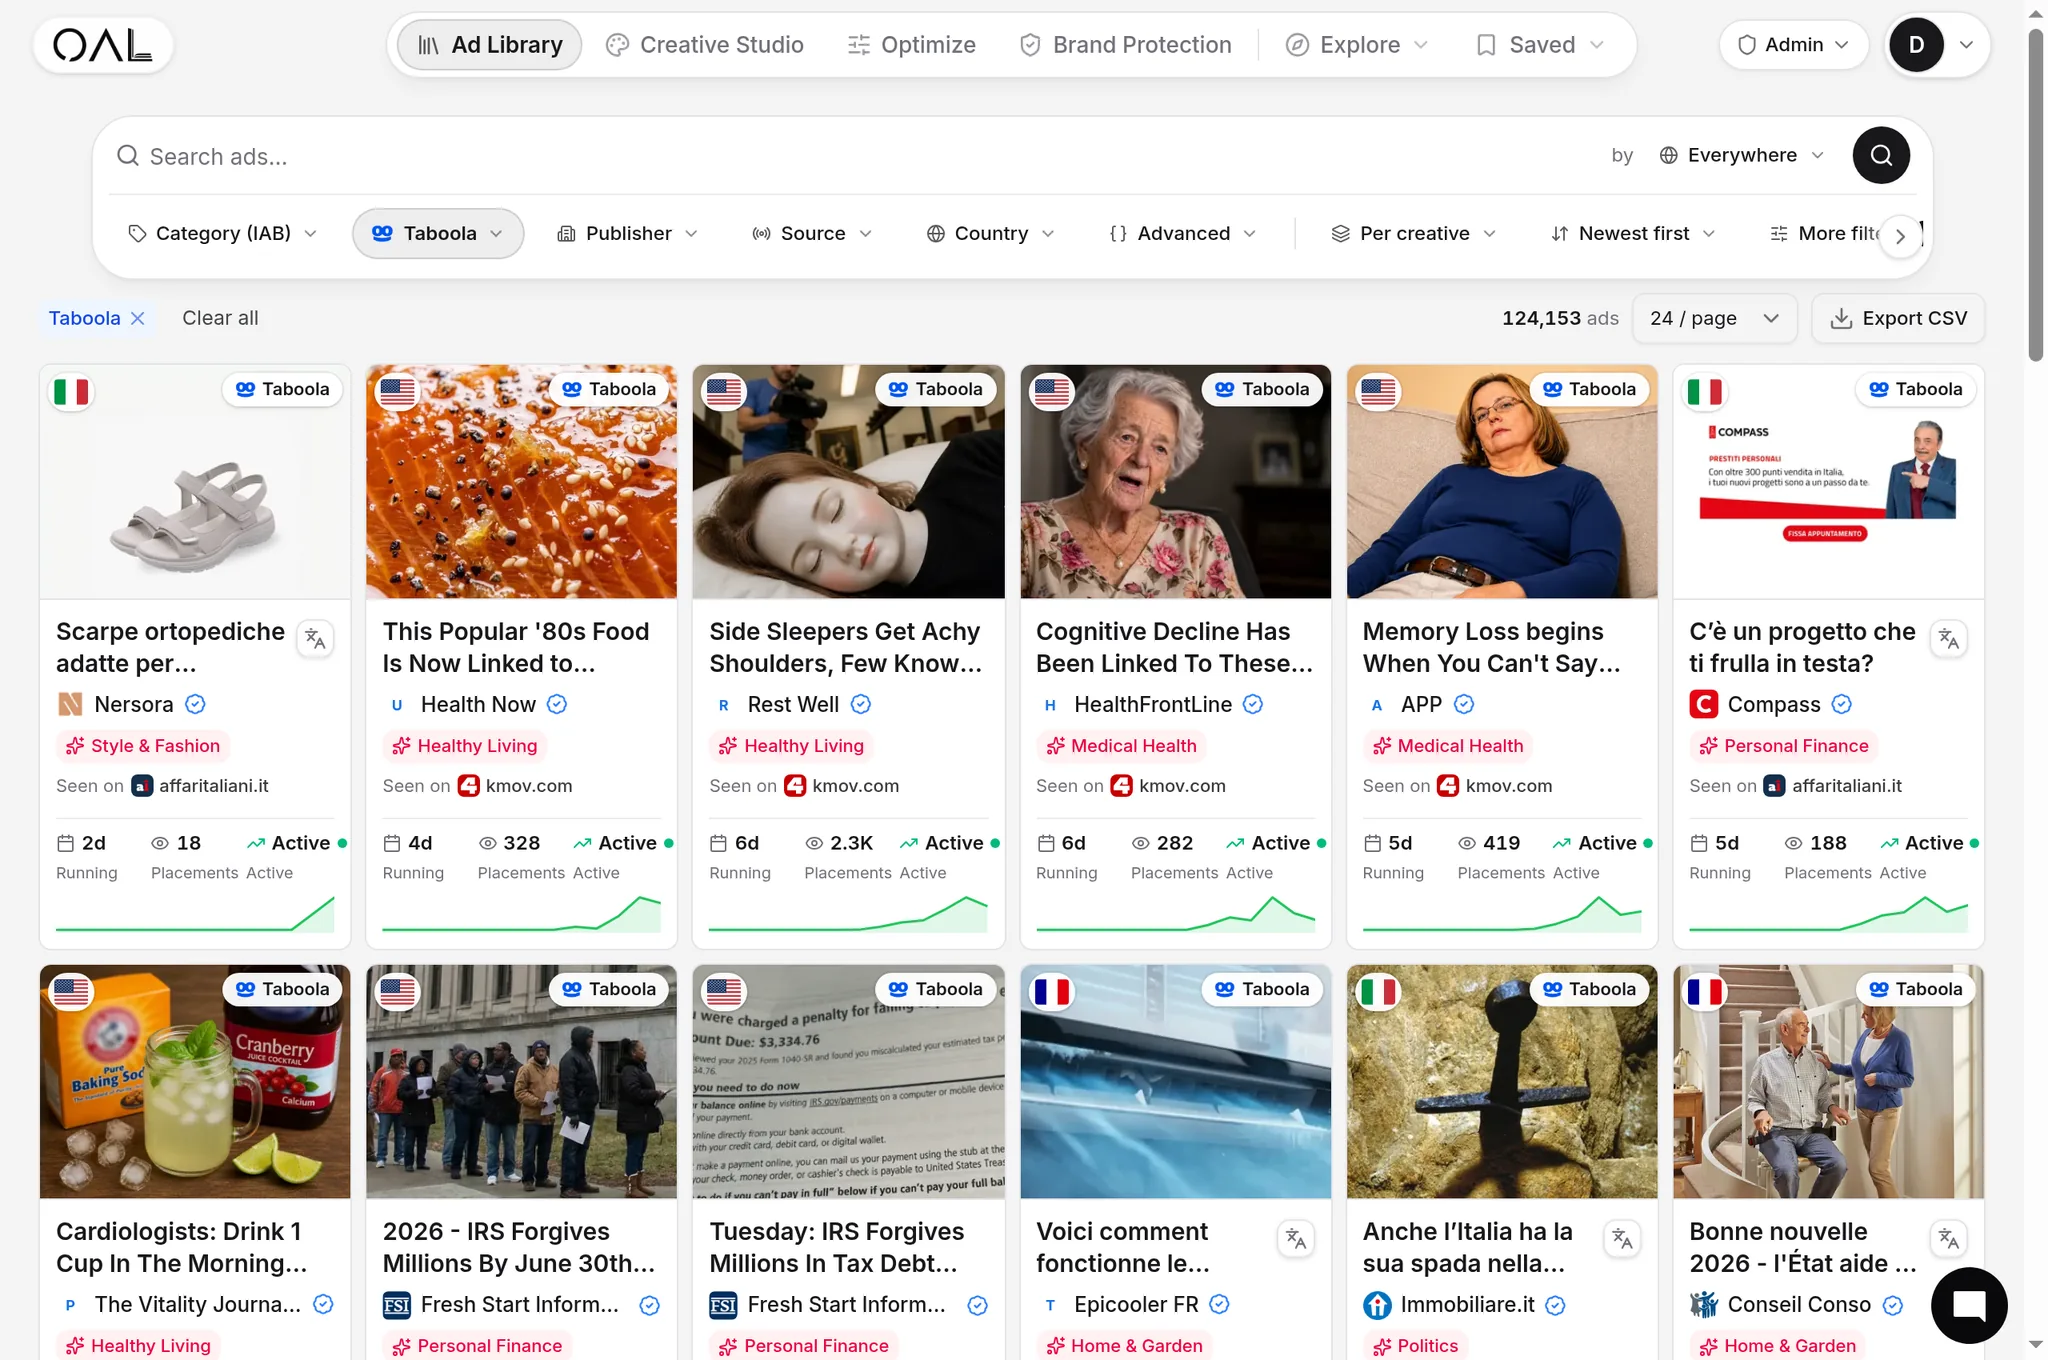
A worked example: pull every live native ad for a competitor in health. You'll see the same playbook over and over. Curiosity gaps, fake-news framing, "doctors hate this" authority plays. Here's a live one from our index:

The "MDs Identify 10 Medications Now Attached to Memory Problems (See the List)" angle is a textbook curiosity-gap listicle hook. When you pull the full set you might find twelve active Taboola variations on that same hook, plus four Outbrain creatives running a cleaner before/after angle. That split is already a finding: they test curiosity hooks on Taboola traffic and proof angles on Outbrain. You did not learn that from one screenshot.
It's not random which verticals dominate this feed. Across our whole index, finance leads with 17,232 creatives, then insurance (15,629), health (14,895) and ecommerce (13,872). On Taboola specifically, health (6,048) and finance (5,558) are the two biggest categories. So if you sell in finance, insurance, or health, the bad news is your space is crowded. The good news is the volume means winning angles surface fast and often.
This evidence layer is what a native ad spy tool exists to provide, and it's the single biggest force-multiplier in the framework. The better your feed, the better every downstream stage. For the network-specific mechanics of pulling Taboola, Outbrain and MGID ads, see how to spy on competitor native ads.
Stage 3: Score the creatives against a rubric#
Now you have evidence. The mistake here is treating all of it as equally interesting. You need a scoring rubric so "I like this ad" becomes "this ad scores 8/10 on a framework I can defend."
Score each creative, or each cluster of near-identical creatives, on five dimensions:
| Dimension | What you're assessing | Why it matters |
|---|---|---|
| Angle | The core psychological hook (curiosity, fear, status, savings, proof) | Angles are reusable across products; this is what you're really mining |
| Offer | Price, discount, risk-reversal, urgency mechanic | Tells you the economics they think they can afford |
| Creative format | Thumbnail style, faces, text-on-image, before/after | The cheapest variable to test on your own side |
| Longevity | How many consecutive days the ad has stayed live | The closest thing to a public "this works" signal |
| Spread | How many publishers and placements run it | Confirms whether they're scaling it or still testing |
The two columns that separate analysts from screenshot-collectors are longevity and spread. A creative running unchanged for weeks across dozens of publishers is not an experiment. It's a proven winner being actively scaled, and it earns a 9 or 10. A creative that appeared three days ago on two sites is a test. Note it, but don't reorganize your strategy around it yet.
Take this one, also live in our index:

"Americans Are Ditching Hearing Aids for This New Device" is a trend-and-curiosity hook, and we've observed it running for 26 days straight. That longevity is the signal. Compare it to the medication-list ad above, which was three days old when we pulled it. Same vertical, very different scores. One is a battle-tested control; the other is an experiment that might die by Friday.
Cluster before you score. Native advertisers run dozens of micro-variations of the same angle with different thumbnail crops. Group them, score the cluster once, and you see the real picture: maybe they have three angles in market, not forty ads. That collapse from forty to three is the actual insight.
Translate scores into a backlog. Every cluster scoring 7+ becomes a hypothesis on your test roadmap: "Adapt the 'doctors are furious' authority angle to our offer, test against our current control." That's the bridge from analysis to action, and it's where conversion rate thinking comes in, because the angle that wins their click still has to survive your landing page.
Stage 4: Infer relative spend from public signals#
You will never see a competitor's media invoice. You don't need to. Two public signals correlate tightly enough with budget to rank advertisers by spend without a single dollar figure.
Signal one, longevity. Direct-response advertisers are ruthless. An unprofitable creative gets killed in days. So the duration a creative stays live is a revealed-preference signal of profitability. An ad still running after weeks is one the advertiser keeps paying to serve, which means it keeps making money. Sum longevity across a competitor's portfolio and you get a proxy for how much working inventory they fund.
A quick caveat on the numbers, since it's the easiest place to fool yourself. Our index currently spans up to about 28 days of continuous observation per creative, so when I say an ad "ran 28 days" I mean we've seen it live every day for as long as we've been watching it, not that 28 is its lifetime ceiling. The general industry lore about "90-day winners" is real but it's lore, not something we can confirm from our own capture window. Treat our day-counts as a floor, not a finish line.
Here's a finance creative sitting at the top of that observed range:

SmartAsset's "Ask a Pro: How Can I Avoid Paying Taxes on IRA Withdrawals?" has been live every day we've watched it. A 28-day finance ad from a serious advertiser is about as strong a "this converts" tell as you get from the outside. Contrast it with this Taboola tax ad:

"2026 - IRS Forgives Millions By June 30th Tax Deadline" leans on a hard date, so its 13-day run partly reflects a deadline mechanic rather than pure durability. Read longevity in context. A deadline ad and an evergreen Q&A ad earn their day-counts differently.
Signal two, volume and spread. Count distinct active creatives, then count the publishers and placements carrying them. Budget shows up as breadth: more concurrent creatives, more publisher domains, more geographies. An advertiser running forty live creatives across thirty sites in five countries operates at a different spend tier than one running five ads on three sites. No invoice required.
Combine them into a simple relative-spend tier you can defend:
| Spend tier | Active creatives | Avg. longevity | Publisher spread |
|---|---|---|---|
| Scaling hard | 25+ | Several multi-week winners | Broad, multi-geo |
| Steady | 8 to 25 | A few durable winners | Moderate, focused geos |
| Testing / small | Under 8 | Mostly recent, short-lived | Narrow, 1 to 2 publishers |
One caution, stated plainly: these are relative signals, not absolute dollars. They rank advertisers against each other and track changes over time. They do not produce a precise budget. Treat any tool claiming an exact spend figure for open-web native with skepticism, because the underlying data to compute it precisely is not public. The honest version of this analysis says "Competitor A is in a clearly higher spend tier than B, and A's spend has been climbing for weeks," which beats a fake-precise dollar number for actual decisions. For the weekly habit that keeps these signals fresh, the media buyer's research routine is the companion to this framework.
Putting it together: a worked end-to-end pass#
Tie the stages into one pass so the framework feels concrete:
- Watchlist. You track eight supplement advertisers across three tiers.
- Pull. A live feed surfaces 140 active native creatives across Taboola, Outbrain and MGID this week.
- Cluster and score. Those 140 collapse into 19 angle clusters. Four score 8+ on longevity and spread: three curiosity-gap hooks and one authority/proof angle that's run nearly four weeks straight.
- Spend inference. Two of the eight advertisers sit in "scaling hard." One grew from 12 to 31 active creatives over a month, a launch you'd otherwise have missed.
- Action. Three of the four winning clusters go onto your test roadmap with adapted offers. You raise your bid in the geos where the scaling competitor just expanded.
That's the difference between watching competitor ads and analyzing them. The screenshot folder produces opinions. The framework produces a roadmap.
The supporting concepts worth knowing#
Two pieces of background sharpen the framework. First, this is one discipline inside the broader practice of competitive intelligence in advertising, the systematic, ethical gathering of public signals about how rivals go to market. Second, native runs on the same plumbing as the rest of the open web. It's programmatic advertising under the hood, which is why the same creative appears across dozens of publishers and why programmatic native winners scale so fast once proven. If your remit also covers banners, the display advertising primer rounds out the picture.
One practical note on the legal and ethical frame, since it always comes up. Studying public competitor ads is legitimate, and regulation is moving toward more transparency, not less. The EU's Digital Services Act now requires very large platforms to maintain public ad repositories, and the Commission has begun enforcing those obligations. The operational line to hold is simple: capture and study public creatives and landing pages, but don't click live ads in ways that cost a competitor money or pollute their data. Tooling that follows the click to the landing page without triggering a live ad click keeps you on the right side of that line. For the full hands-on method of finding what's running, see how to find out what ads your competitor is running.
Where OpenAdLibrary fits#
The framework is tool-agnostic. You can run it manually with enough patience. But Stages 2 and 4 are where a purpose-built source pays for itself: a continuously refreshed library of live native ads, captured at full creative quality, with the supply chain classified and the click traced to the landing page. We do exactly that across Taboola, Outbrain, MGID, Revcontent, Yahoo, MSN and more, and we surface the longevity and spread signals this framework runs on. The whole thing currently spans 589,036 creatives and 5.4 million ad observations (OpenAdLibrary index, June 2026), at $29.99/mo against rivals charging $80 to $400. You can browse 200 ads on the free tier with no card to pressure-test the workflow on your own competitors first. Start free and build your watchlist today.