English
 Español
 Português (Brasil)
 Français
 Deutsch
 Italiano
 Nederlands
 Polski
 Svenska
 Türkçe
 日本語
日本語 한국어
한국어 简体中文
简体中文 Tiếng Việt
 Bahasa Indonesia
 繁體中文
繁體中文 Čeština
 Dansk
Dansk Norsk (bokmål)
 Suomi
Suomi Ελληνικά
 Română
 Magyar
 Українська
 ไทย
ไทย हिन्दी
 العربية
 עברית
עבריתКак проводить анализ рекламы конкурентов: пошаговая методика (2026)
Практическая четырехэтапная методика превращения активных нативных объявлений конкурента в ранжированный список выигрышных подходов, оценку относительного бюджета и бэклог креативов для тестирования на следующей неделе.


Большинство «анализов рекламы конкурентов» сводится к открытию сайта соперника, беглому взгляду на любое загрузившееся объявление и сохранению скриншота в папку, которую никто не откроет. Это разведка. Это не анализ. Анализ означает превращение потока активных объявлений в решения: какой подход скопировать, какое предложение перебить, куда вложить следующий тестовый доллар.
Вот методика, которую я использую для нативных кампаний. Четыре этапа: создать список наблюдения, собрать активные объявления, оценить креативы, вывести относительный бюджет. Каждый этап выдает что-то, что вы реально используете, а не отчет, который умрет в презентации. Я буду использовать реальные захваты Taboola и Outbrain из нашего собственного индекса в качестве рабочих примеров, потому что в нативной рекламе эта дисциплина окупается лучше всего. Креативы дешево копировать, офферы агрессивны, а победители скрываются на виду на страницах издателей, которые вы бы не подумали проверить.
Для масштаба: вот как выглядит один срез открытого веба прямо сейчас: мы захватили 589 036 креативов от 25 933 рекламодателей в 42 сетях (индекс OpenAdLibrary, июнь 2026). На Taboola приходится 157 727 из этих креативов, на Outbrain — 84 252. Это стог сена. Методика ниже — это то, как вы извлекаете из него сигнал.
Что на самом деле дает анализ рекламы конкурентов#
Анализ рекламы конкурентов — это систематическое изучение рекламных кампаний соперника (креативы, офферы, площадки размещения и сроки активности каждого объявления), чтобы понять, что работает для них и где вы можете выиграть. Результат — не папка со скриншотами. Это ранжированный список проверенных подходов, оценка относительного бюджета, построенная на публичных сигналах, и приоритизированный бэклог креативов, который вы можете протестировать на следующей неделе.
Это определение задает планку. Если ваш процесс заканчивается на «вот их реклама», вы провели разведку. Если он заканчивается на «вот три подхода, которые превосходят все остальные, вот кто тратит больше нас и где, и вот пять креативов, которые мы тестируем первыми», вы провели анализ. Четыре этапа ведут ко второму результату. Если вам нужен более широкий контекст по нативной, дисплейной и социальной рекламе, общее руководство по шпионажу за рекламой конкурентов определяет место этой методики.
Этап 1: Создайте список наблюдения, за которым стоит наблюдать#
Все последующие этапы зависят от мониторинга правильного набора рекламодателей. Слишком широкий — утонете в шуме. Слишком узкий — пропустите соперника, который тихо крадет ваших лучших клиентов.
Создайте три уровня:
- Прямые конкуренты. Компании, продающие то же самое тому же покупателю. Очевидно, но будьте конкретны: включите бренды и shell- или аффилированные компании, под которыми они запускают рекламу, они часто отличаются от корпоративного названия.
- Лидеры категории. Крупнейшие тратящие в вашей вертикали, даже на размер больше вас. Они финансируют больше всего креативного тестирования, поэтому первыми выявляют выигрышные подходы. Вы копируете подход, а не бюджет.
- Агрессивные аффилиаты. Ловкие операторы, которые живут и умирают по ROI нативной рекламы. Они итерируют быстрее всех и не имеют брендовых ограничений, что делает их лучшим ранним индикатором того, что конвертирует прямо сейчас.
Самый ценный рекламодатель в вашем списке наблюдения — редко ваш прямой конкурент. Это аффилиат на три шага впереди вас, который уже отсеял проигрышные подходы и запускает только победителей, потому что его маржа не переживет ничего другого.
Для каждой записи фиксируйте реальную рекламную сущность, целевые домены, которые они используют, и сети, на которых вы их видели. Часть про «реальную рекламную сущность» в нативной рекламе сложнее, чем кажется. Объявления проходят через редиректы для отслеживания, и бренд, отображаемый в креативе, часто не является сущностью, которая за него платит. Платформа, которая определяет реального рекламодателя за каждым размещением, сэкономит вам часы ручной расшифровки редиректов. Если создание списка наблюдения — это то, в чем вы хотите углубиться, воркфлоу от списка наблюдения к действию подробно рассматривает уровни и поддержку.
Этап 2: Собирайте активные объявления, слой доказательств#
Список наблюдения бесполезен без постоянного потока данных о том, что эти рекламодатели на самом деле запускают. Здесь ломается большинство DIY-процессов. Ручное обновление страниц издателей, чтобы поймать объявление конкурента, медленно, зависит от гео и пропускает все, что показывается вне вашей собственной сессии.
Вам нужен источник, который непрерывно захватывает активные, публичные нативные объявления на разных издателях и в разных гео и сохраняет реальный креатив, а не миниатюру. Безоговорочные требования:
- Захват в реальном времени, а не устаревший архив. Библиотека, которая обновлялась недели назад, говорит вам, что запускалось, а не что запускается. Актуальность — в этом весь смысл.
- Креатив в полном качестве. Вы будете изучать изображение, формулировку заголовка, композицию миниатюры. Размытый кадр — это улика, которую нельзя прочитать.
- Классифицированная цепочка поставок. Знание того, что объявление запущено на Taboola против Outbrain (ныне работающих как Teads после слияния в начале 2025) против MGID, говорит вам, в какие аукционы покупает ваш конкурент.
- Клик, прослеженный до целевой страницы. Креатив — это крючок. Целевая страница — это где делаются деньги. Анализ, который останавливается на изображении объявления, упускает половину воронки.
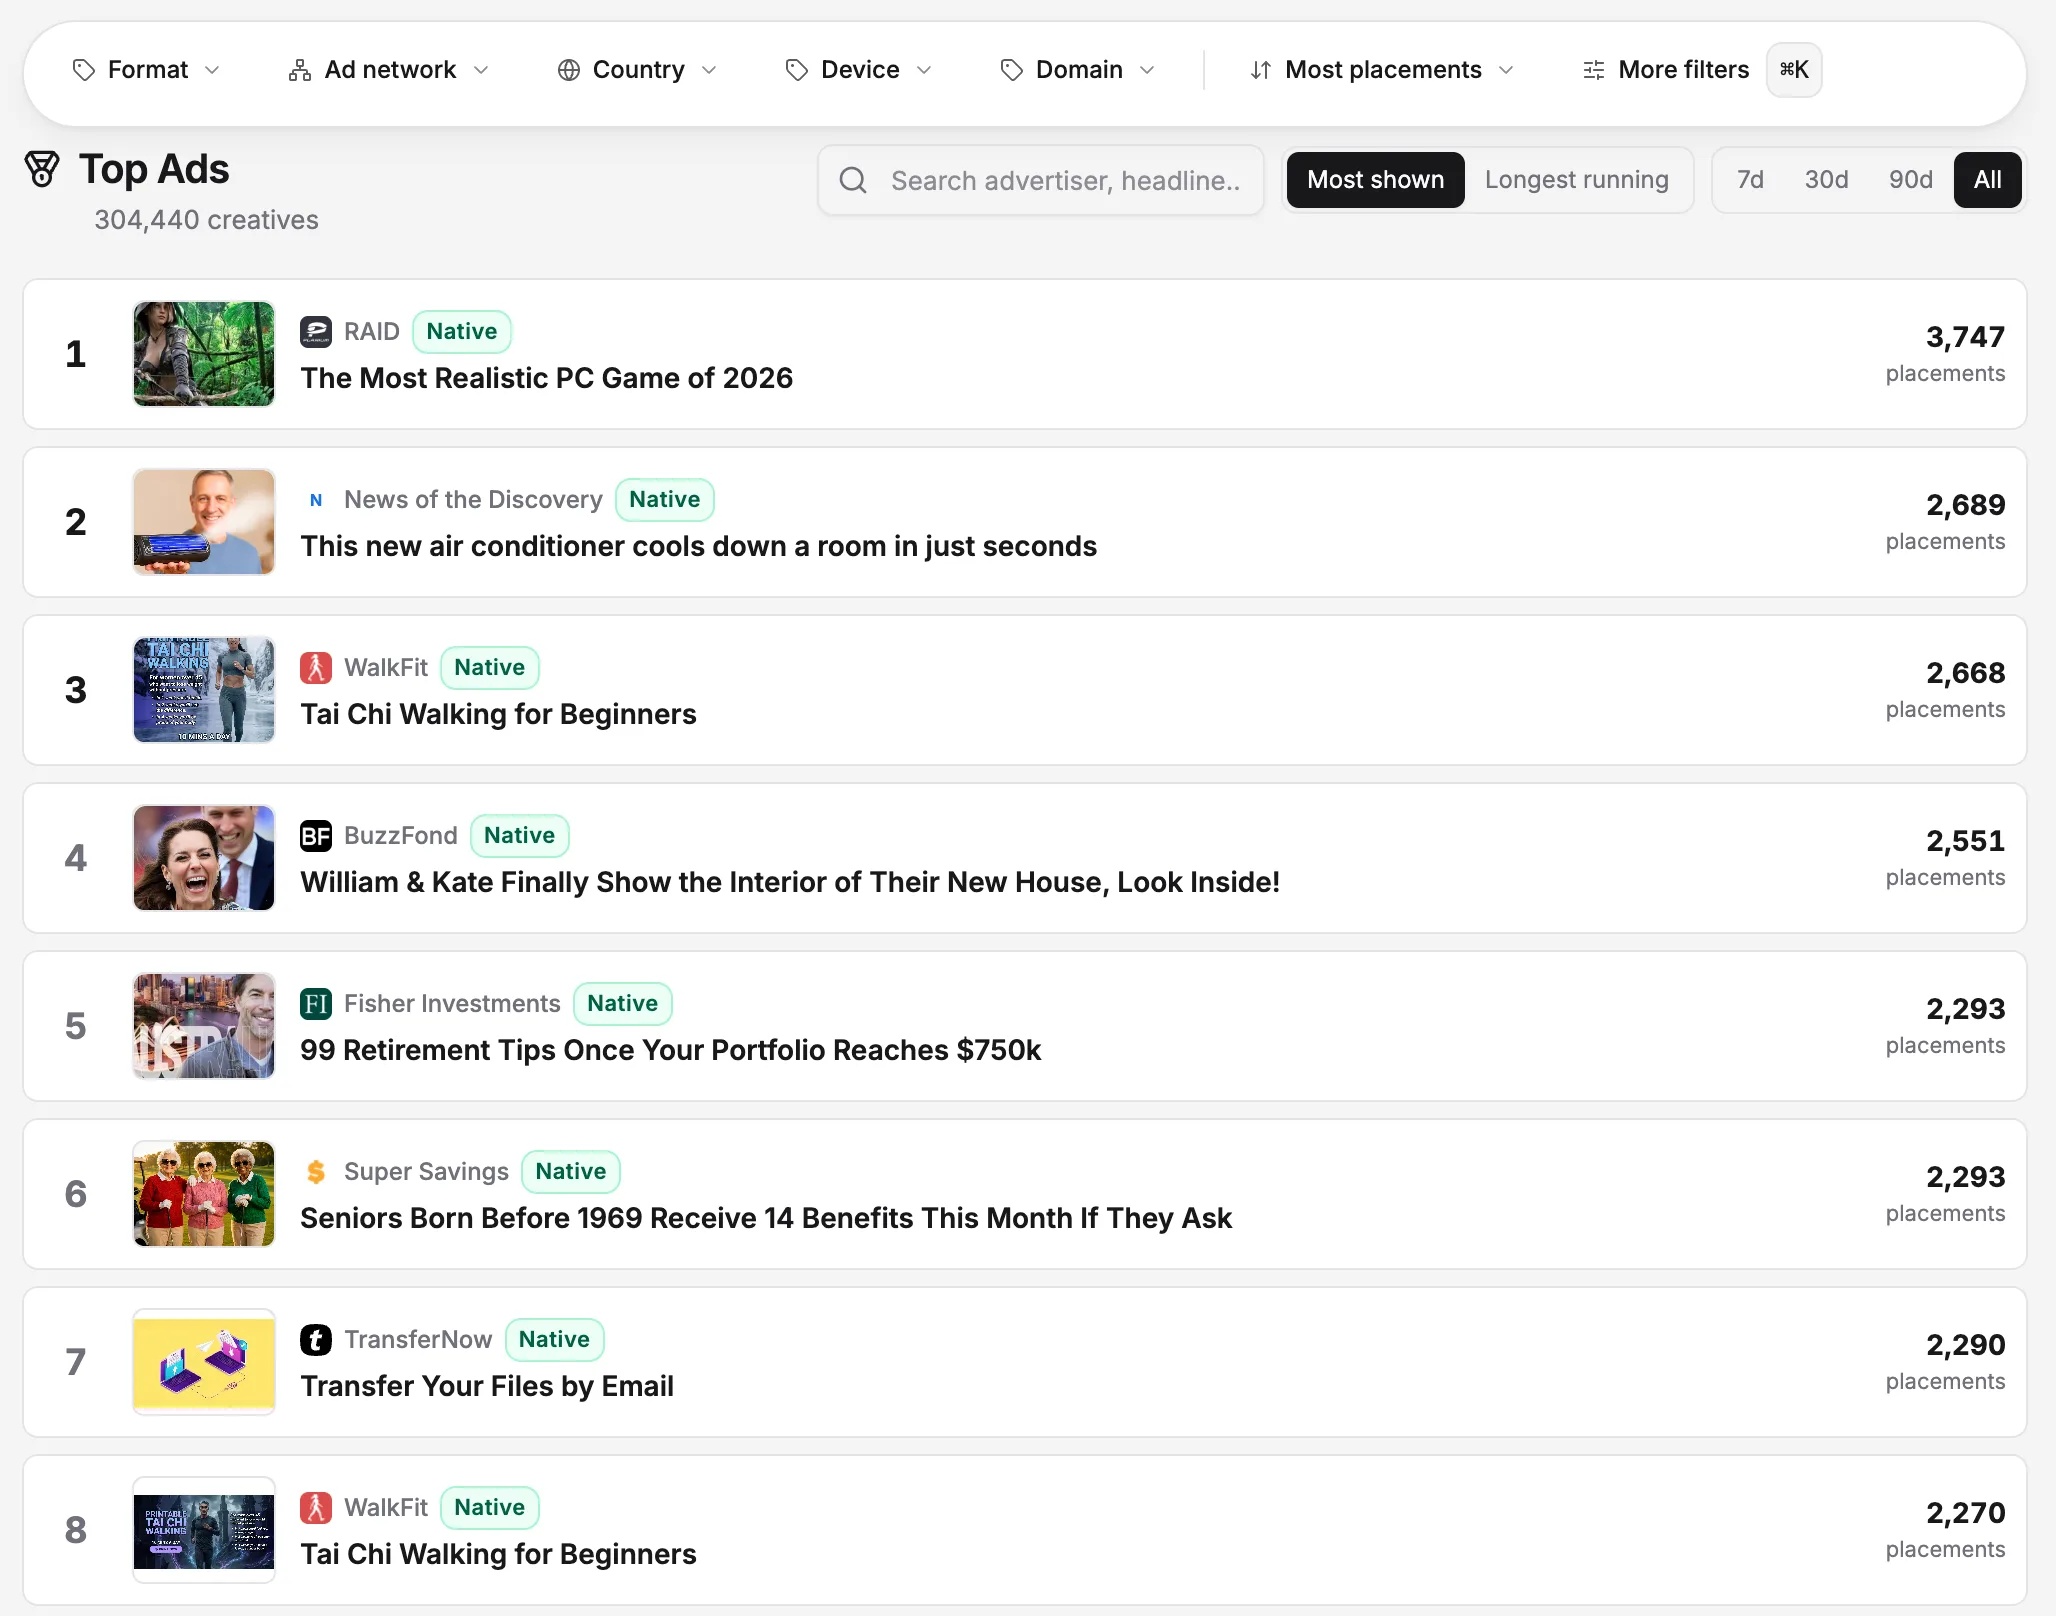
Рабочий пример: соберите все активные нативные объявления для конкурента в сфере здравоохранения. Вы увидите один и тот же плейбук снова и снова. Любопытные пробелы, фрейминг под фейковые новости, апелляции к авторитету типа «врачи ненавидят это». Вот живой пример из нашего индекса:

Подход «Врачи выявили 10 лекарств, связанных с проблемами памяти (посмотрите список)» — это классический крючок для листинга, основанный на пробеле в любопытстве. Когда вы соберете полный набор, вы можете обнаружить двенадцать активных вариаций Taboola на этот же крючок плюс четыре креатива Outbrain, использующих более чистый подход «до/после». Это разделение уже является находкой: они тестируют крючки любопытства на трафике Taboola и подходы с доказательствами на Outbrain. Вы не узнали бы этого из одного скриншота.
Не случайно, какие вертикали доминируют в этом потоке. По всему нашему индексу лидируют финансы с 17 232 креативами, затем страхование (15 629), здравоохранение (14 895) и ecommerce (13 872). Конкретно на Taboola здравоохранение (6 048) и финансы (5 558) — две крупнейшие категории. Так что если вы продаете в сфере финансов, страхования или здравоохранения, плохая новость в том, что ваша ниша переполнена. Хорошая новость в том, что объем означает, что выигрышные подходы появляются быстро и часто.
Этот слой доказательств — то, для чего существует инструмент для шпионажа за нативной рекламой, и это самый большой мультипликатор силы в этой методике. Чем лучше ваш поток, тем лучше каждый последующий этап. Что касается сетевой механики сбора объявлений Taboola, Outbrain и MGID, см. как шпионить за нативной рекламой конкурентов.
Этап 3: Оцените креативы по системе критериев#
Теперь у вас есть доказательства. Ошибка здесь — считать все одинаково интересным. Вам нужна система критериев, чтобы «мне нравится это объявление» превратилось в «это объявление набирает 8/10 по системе, которую я могу обосновать».
Оценивайте каждый креатив или кластер почти идентичных креативов по пяти измерениям:
| Измерение | Что оцениваете | Почему это важно |
|---|---|---|
| Подход | Основной психологический крючок (любопытство, страх, статус, экономия, доказательство) | Подходы можно повторно использовать для разных продуктов; это то, что вы на самом деле добываете |
| Оффер | Цена, скидка, снижение риска, механика срочности | Показывает экономику, которую, по их мнению, они могут себе позволить |
| Формат креатива | Стиль миниатюры, лица, текст на изображении, до/после | Самая дешевая переменная для тестирования на вашей стороне |
| Долголетие | Сколько дней подряд объявление остается активным | Ближайший аналог публичного сигнала «это работает» |
| Распространенность | На скольких издателях и площадках размещения оно запущено | Подтверждает, масштабируют ли они его или все еще тестируют |
Два столбца, которые отделяют аналитиков от коллекционеров скриншотов, — это долголетие и распространенность. Креатив, работающий без изменений неделями на десятках издателей, — не эксперимент. Это проверенный победитель, который активно масштабируется, и он заслуживает 9 или 10 баллов. Креатив, появившийся три дня назад на двух сайтах, — это тест. Отметьте его, но пока не перестраивайте свою стратегию вокруг него.
Возьмем этот пример, также активный в нашем индексе:

«Американцы отказываются от слуховых аппаратов ради этого нового устройства» — это крючок, основанный на тренде и любопытстве, и мы наблюдали его работу в течение 26 дней подряд. Это долголетие и есть сигнал. Сравните его с объявлением о списке лекарств выше, которому было три дня, когда мы его собрали. Та же вертикаль, очень разные оценки. Один — проверенный в боях контрольный вариант; другой — эксперимент, который может закончиться к пятнице.
Кластеризуйте перед оценкой. Нативные рекламодатели запускают десятки микровариаций одного и того же подхода с разными кадрированными миниатюрами. Сгруппируйте их, оцените кластер один раз, и вы увидите реальную картину: возможно, у них на рынке три подхода, а не сорок объявлений. Это сжатие с сорока до трех и есть настоящее понимание.
Превращайте оценки в бэклог. Каждый кластер с оценкой 7+ становится гипотезой в вашей дорожной карте тестов: «Адаптировать подход апелляции к авторитету «врачи в ярости» под наш оффер, протестировать против нашего текущего контроля». Это мост от анализа к действию, и здесь вступает в дело мышление в терминах конверсии, потому что подход, который выигрывает их клик, все еще должен пройти вашу целевую страницу.
Этап 4: Выведите относительный бюджет из публичных сигналов#
Вы никогда не увидите медийный счет конкурента. Вам это и не нужно. Два публичных сигнала достаточно тесно коррелируют с бюджетом, чтобы ранжировать рекламодателей по тратам без единой цифры в долларах.
Сигнал первый, долголетие. Рекламодатели прямого отклика беспощадны. Нерентабельный креатив убивается за дни. Таким образом, продолжительность активности креатива — это сигнал выявленных предпочтений о его прибыльности. Объявление, все еще работающее спустя недели, — это то, за показ которого рекламодатель продолжает платить, а значит, оно продолжает приносить деньги. Суммируйте долголетие по портфелю конкурента, и вы получите прокси того, сколько работающего инвентаря он финансирует.
Краткое предостережение насчет цифр, так как здесь легче всего обмануться. Наш индекс в настоящее время охватывает до примерно 28 дней непрерывного наблюдения за креативом, поэтому, когда я говорю, что объявление «работало 28 дней», я имею в виду, что мы видели его активным каждый день, пока мы за ним наблюдали, а не то, что 28 — это его потолок. Общая отраслевая мудрость о «победителях на 90 дней» реальна, но это мудрость, а не то, что мы можем подтвердить из нашего собственного окна захвата. Относитесь к нашим подсчетам дней как к нижней границе, а не к финишной черте.
Вот финансовый креатив, находящийся на вершине этого наблюдаемого диапазона:

«Спросите у профессионала: Как я могу избежать уплаты налогов при снятии средств с IRA?» от SmartAsset было активным каждый день, пока мы за ним наблюдали. Финансовое объявление, работающее 28 дней от серьезного рекламодателя, — это самый сильный сигнал «это конвертирует», который можно получить извне. Сравните его с этим налоговым объявлением на Taboola:

«2026 — IRS прощает миллионы к налоговому дедлайну 30 июня» опирается на жесткую дату, поэтому его 13-дневный срок работы частично отражает механику дедлайна, а не чистую долговечность. Интерпретируйте долголетие в контексте. Объявление с дедлайном и вечнозеленое Q&A зарабатывают свои дни по-разному.
Сигнал второй, объем и распространенность. Подсчитайте уникальные активные креативы, затем подсчитайте издателей и площадки размещения, на которых они показываются. Бюджет проявляется в широте: больше одновременных креативов, больше доменов издателей, больше гео. Рекламодатель, запускающий сорок активных креативов на тридцати сайтах в пяти странах, работает на другом уровне трат, чем тот, кто запускает пять объявлений на трех сайтах. Счет не требуется.
Объедините их в простой, обоснованный уровень относительных трат:
| Уровень трат | Активных креативов | Ср. долголетие | Распространенность по издателям |
|---|---|---|---|
| Активно масштабируют | 25+ | Несколько победителей, работающих неделями | Широкая, мультигео |
| Стабильный | от 8 до 25 | Несколько долговечных победителей | Умеренная, сфокусированная гео |
| Тестируют / небольшие | Менее 8 | В основном свежие, недолговечные | Узкая, 1-2 издателя |
Одна осторожность, выраженная прямо: это относительные сигналы, а не абсолютные доллары. Они ранжируют рекламодателей друг относительно друга и отслеживают изменения во времени. Они не выдают точный бюджет. Относитесь скептически к любому инструменту, который заявляет о точной сумме трат для нативной рекламы в открытом вебе, потому что исходные данные для ее точного вычисления не являются публичными. Честная версия этого анализа говорит: «Конкурент А явно находится на более высоком уровне трат, чем Б, и траты А растут уже несколько недель», что для реальных решений лучше поддельно-точной цифры в долларах. Для еженедельной привычки, которая поддерживает актуальность этих сигналов, исследовательская рутина медиабаера является дополнением к этой методике.
Собираем все вместе: сквозной рабочий проход#
Свяжите этапы в один проход, чтобы методика стала конкретной:
- Список наблюдения. Вы отслеживаете восемь рекламодателей пищевых добавок на трех уровнях.
- Сбор. Активный поток выявляет 140 активных нативных креативов на Taboola, Outbrain и MGID на этой неделе.
- Кластеризация и оценка. Эти 140 сворачиваются в 19 кластеров подходов. Четыре набирают 8+ баллов по долголетию и распространенности: три крючка с пробелом в любопытстве и один подход с авторитетом/доказательствами, который работает почти четыре недели подряд.
- Вывод о бюджете. Двое из восьми рекламодателей находятся в категории «активно масштабируют». Один вырос с 12 до 31 активного креатива за месяц — это запуск, который вы бы иначе пропустили.
- Действие. Три из четырех выигрышных кластеров попадают в вашу дорожную карту тестов с адаптированными офферами. Вы повышаете ставки в гео, куда масштабирующийся конкурент только что расширился.
В этом разница между наблюдением за рекламой конкурентов и ее анализом. Папка со скриншотами порождает мнения. Методика порождает дорожную карту.
Поддерживающие концепции, которые стоит знать#
Два фоновых момента оттачивают методику. Во-первых, это одна дисциплина в рамках более широкой практики конкурентной разведки в рекламе, систематического и этичного сбора публичных сигналов о том, как соперники выходят на рынок. Во-вторых, нативная реклама работает на той же инфраструктуре, что и остальной открытый веб. Под капотом это программатик-реклама, поэтому один и тот же креатив появляется на десятках издателей и почему победители в программатик-нативной рекламе масштабируются так быстро после подтверждения. Если ваша сфера ответственности также включает баннеры, введение в дисплейную рекламу дополняет картину.
Одно практическое замечание о правовых и этических рамках, поскольку этот вопрос всегда возникает. Изучение публичной рекламы конкурентов законно, и регулирование движется в сторону большей прозрачности, а не меньшей. Акт о цифровых услугах ЕС (Digital Services Act) теперь обязывает очень крупные платформы вести публичные репозитории рекламы, и Комиссия начала применять эти обязательства. Операционная граница, которую нужно соблюдать, проста: захватывайте и изучайте публичные креативы и целевые страницы, но не кликайте по активным объявлениям так, чтобы это стоило денег конкуренту или загрязняло его данные. Инструменты, которые отслеживают клик до целевой страницы без триггера реального клика по объявлению, держат вас по правильную сторону этой границы. Полный практический метод поиска того, что запущено, см. в как узнать, какую рекламу запускает ваш конкурент.
Место OpenAdLibrary#
Методика не зависит от инструментов. Вы можете запустить ее вручную при достаточном терпении. Но на Этапах 2 и 4 специальный источник окупает себя: постоянно обновляемая библиотека активных нативных объявлений, захваченных в полном качестве креативов, с классифицированной цепочкой поставок и кликом, прослеженным до целевой страницы. Мы делаем именно это на Taboola, Outbrain, MGID, Revcontent, Yahoo, MSN и других, и мы выявляем сигналы долголетия и распространенности, на которых работает эта методика. Вся система в настоящее время охватывает 589 036 креативов и 5,4 миллиона наблюдений за объявлениями (индекс OpenAdLibrary, июнь 2026), по цене $29.99/мес. против конкурентов, берущих от $80 до $400. Вы можете просмотреть 200 объявлений на бесплатном тарифе без карты, чтобы сначала протестировать воркфлоу на своих конкурентах. Начните бесплатно и создайте свой список наблюдения уже сегодня.